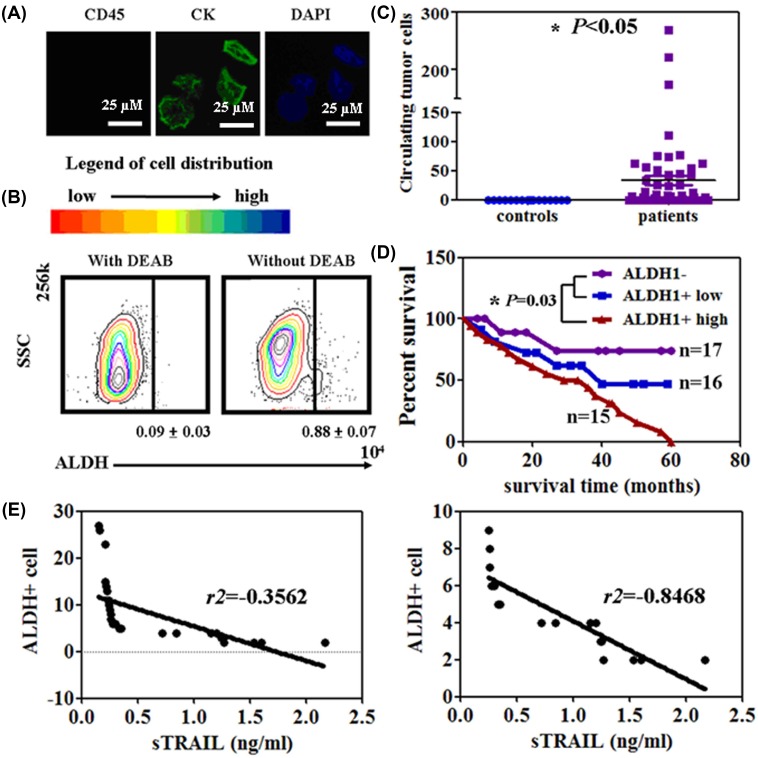
Figure 2. Isolation of circulating ALDH1+ cells from the serum of NSCLC patients.
(A) CTCs are identified by using the Immunofluorescence assay with CK, DAPI, and CD45. (B) ALDEFLUOR FACS analysis of the CTCs. (C) Circulating ALDH1+ cells were calculated by using FCM in patients and healthy controls. *P<0.05 (D) Kaplan–Meier curves of the cumulative survival rate of the NSCLC patients based on the number of circulating ALDH1+ cells. *P=0.03 (E) Correlation between sTRAIL and circulating ALDH1+ cells in the NSCLC patients.

