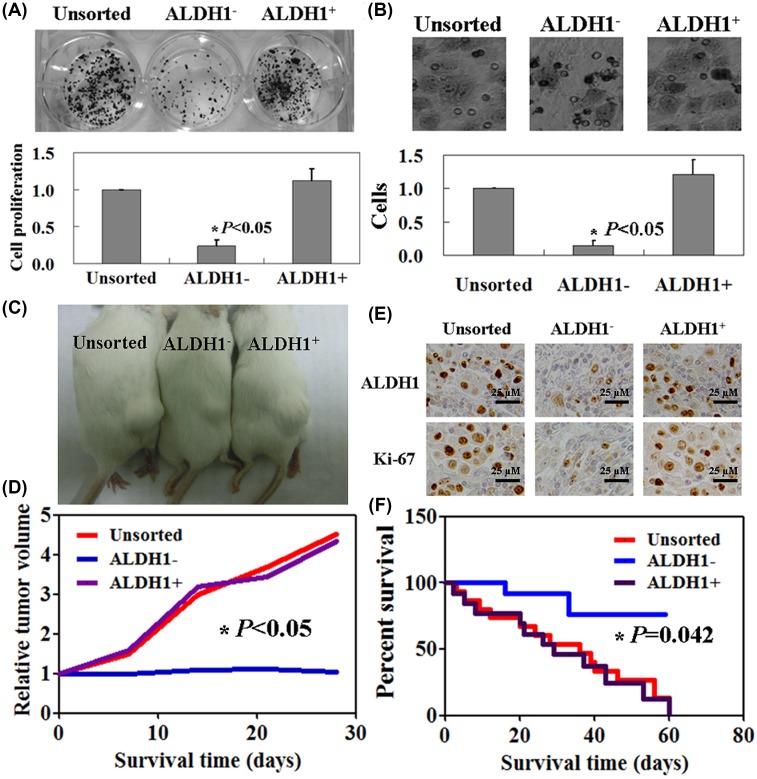
Figure 3. Tumorigenic properties of ALDH1+ cells in vitro and in vivo.
(A) The proliferation rate of unsorted, ALDH1−, and ALDH1+ cells was assayed by using the colony formation assay. *P<0.05 (B) Transwell assay was used to detect the mobility of unsorted, ALDH1−, and ALDH1+ cells. *P<0.05 (C) Macroscopic appearance of subcutaneous tumors in unsorted, ALDH1−, and ALDH1+ cells injected mouse models. (D) The tumor volume of each group as described above. *P<0.05 (E) Immunohistochemical staining of resected tumor tissues from each group using ALDH1 and Ki67. (F) Kaplan–Meier survival curves of each group as described above. *P<0.05

