Figure 4.
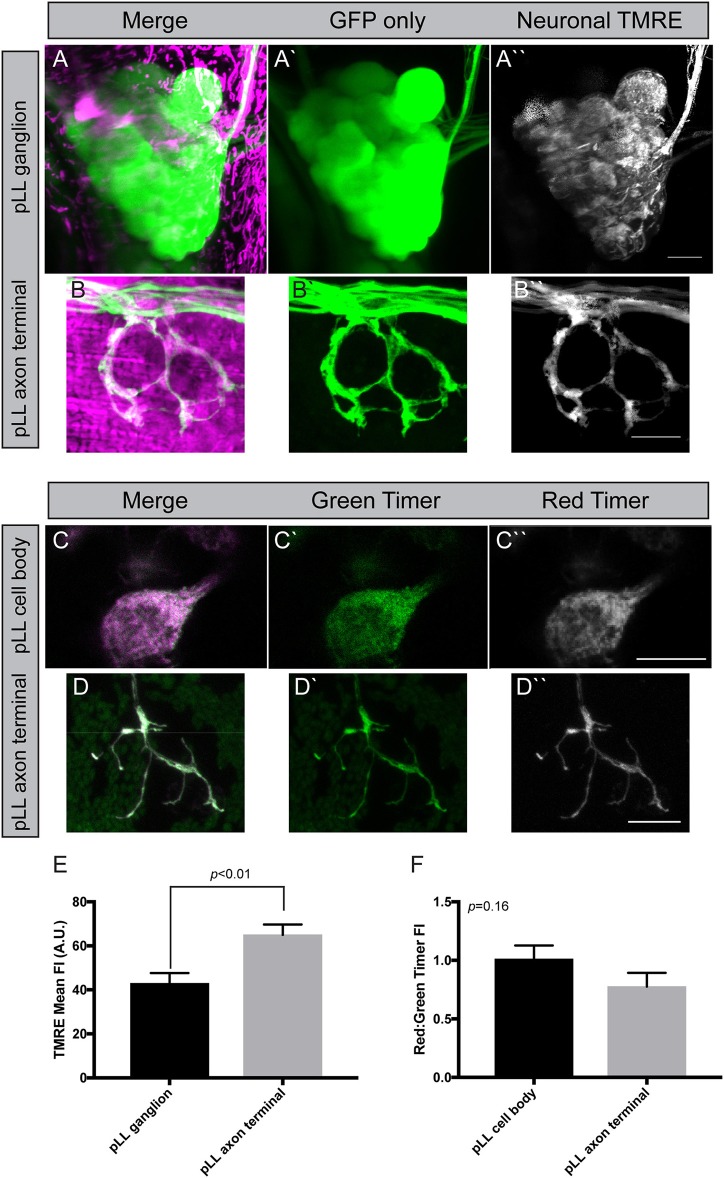
Measuring mitochondrial health in neurons. (A,B) Incubation of zebrafish larvae at 4 dpf with 25 μM TMRE results in strong labeling in pLL ganglia and axon terminals (shown in magenta). Cytoplasmic GFP marks the axons. Image subtraction in ImageJ allows analysis of TMRE labeling in neurons (identified by neurod:egfp transgene expression). (C,D) Transient transgenesis using a 5kbneurod:mito-Timer construct allows imaging of the oxidation-sensitive protein Timer in individual pLL neurons and axon terminals in larval zebrafish at 4 dpf. Green Timer is native while red Timer (shown in magenta) is oxidized. (E) Quantification of TMRE fluorescence intensity shows elevated TMRE labeling in axon terminals compared to cell bodies, an indicator of higher matrix potential (ANOVA; n = 7 larvae). (F) The red:green Timer ratio is slightly, but not significantly reduced in axon terminals (ANOVA; n = 16 larvae). Scale bar = 10 μm.

