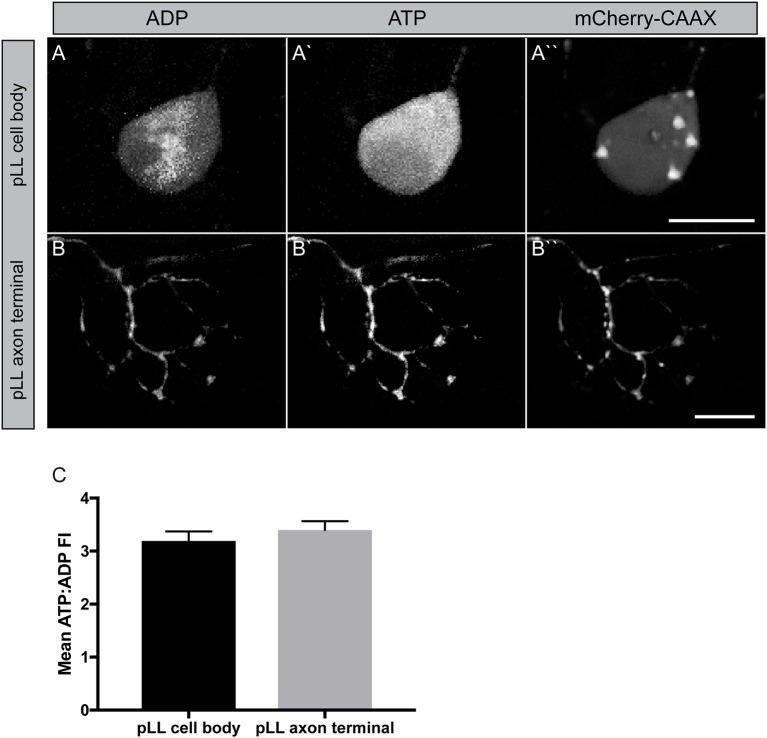
Figure 5.
Measuring mitochondrial productivity in vivo. (A,B) Transient 5kbneurod:PercevalHRp2amCherry-CAAX expression in a pLL neuron (A) and pLL axon terminal (B) allows imaging of ADP with 420 nm excitation (A,B) and ATP with 500 nm excitation (A′,B′). mCherry expression used to identify the neuron. (C) Quantification of the ATP: ADP ratio showed similar levels of mitochondrial productivity in these regions (ANOVA; n = 21 larvae). Scale bar = 10 μm.

