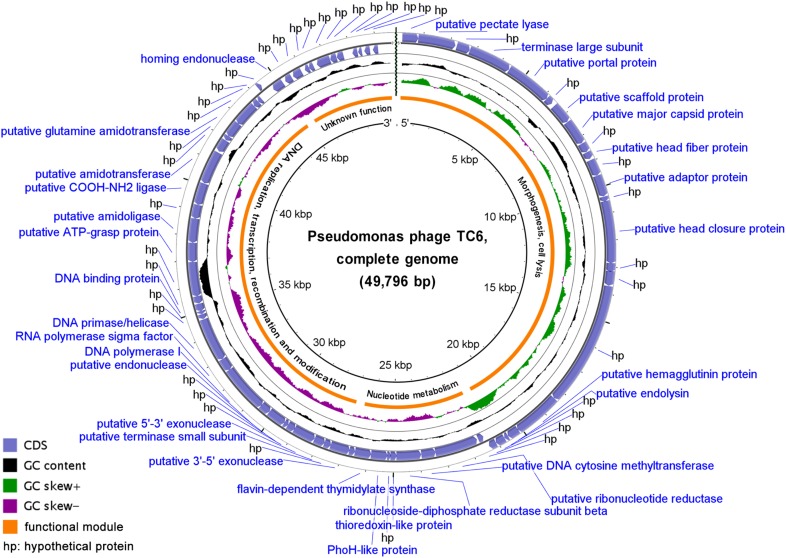
FIGURE 3.
Circular presentation of the TC6 genome. The products of predicted genes were indicated in the outermost region. The outermost ring denotes genes on the plus strand, followed by rings that depict genes on the minus strand, GC content (black), GC skew (purple/green), functional modules, and position scales.

