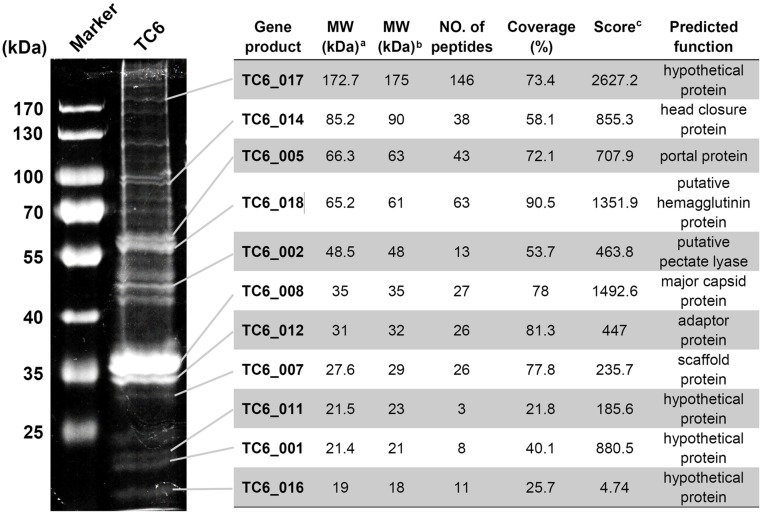
FIGURE 4.
Identification of TC6 structural proteins. Proteins were visualized by SDS-PAGE analysis in a 10% (w/v) gel. The detailed results of HPLC-MS analysis were indicated on the right side of the figure. aMW value was theoretically calculated. bMW value was experimentally estimated. cDistinct summed MS/MS search score.

