FIGURE 8.

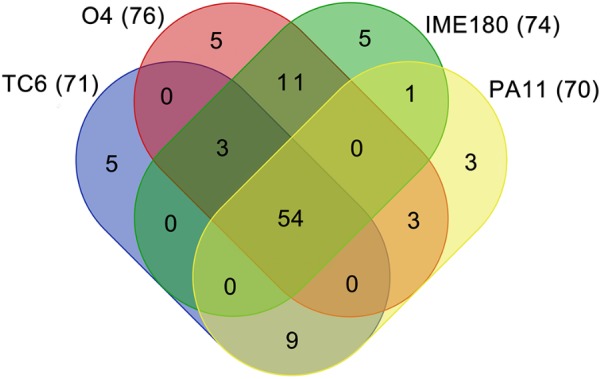
Venn diagram of genomes of Pa11virus. The results of core genes analysis are shown. The number of proteins were indicated in parenthesis.

Venn diagram of genomes of Pa11virus. The results of core genes analysis are shown. The number of proteins were indicated in parenthesis.