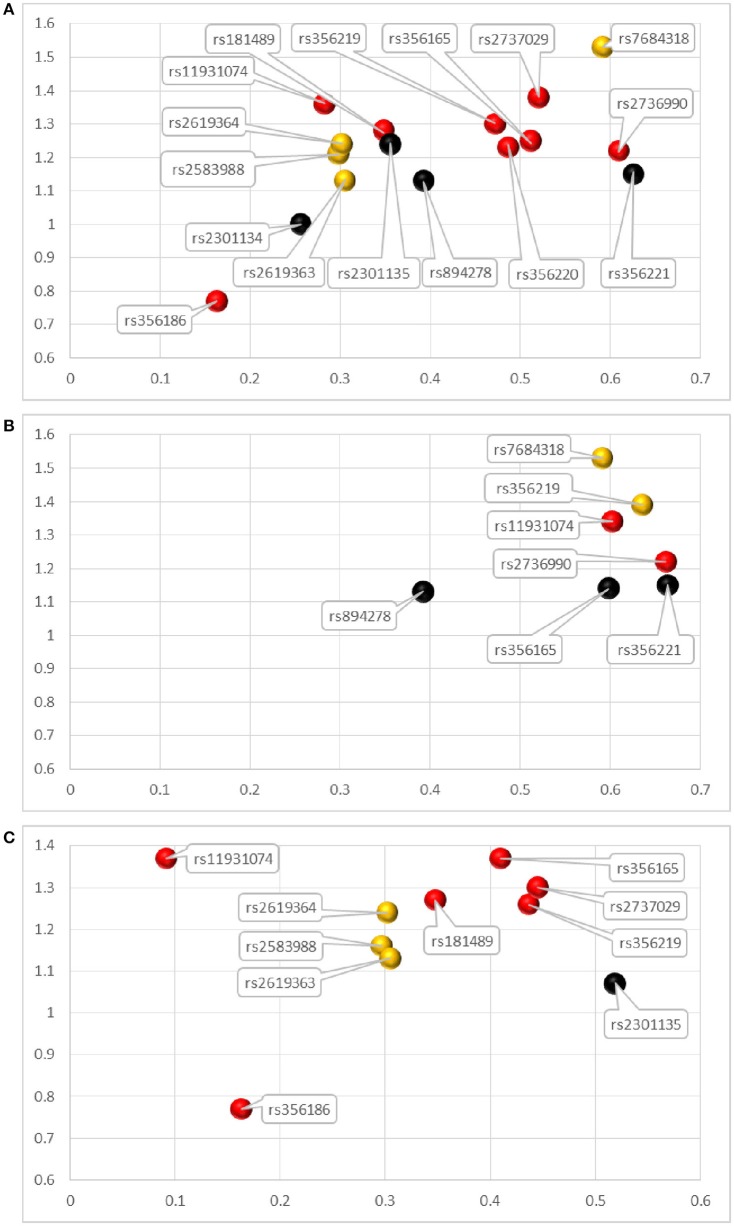
Figure 2.
Attributions for SNCA variants analyzed in the meta-analysis. (A–C) represent the SNCA variants conducted pooled analysis in the overall populations, East Asian group and European group, respectively. The horizonal axis represents the allele frequencies (AFs) of variants and vertical axis represents the odds ratios (ORs). The red bubbles represent the most recommended SNPs for the genetic screening of SNCA, with p< 1 × 10⁻⁵. The orange bubbles represent the recommended SNPs, with p < 0.05. The black bubbles represent SNPs not recommended for genetic screening of SNCA, with no meaningful p-values.

