
Figure 3.
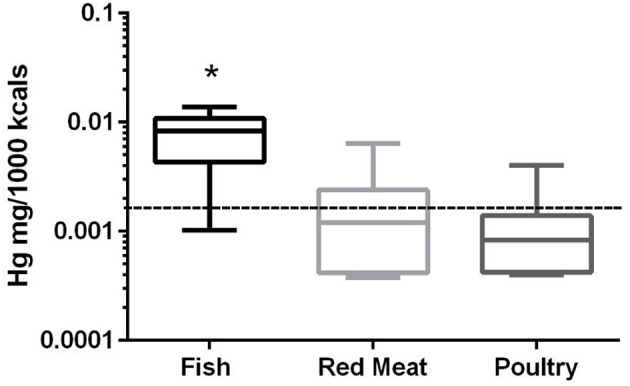
Box-and-whisker plots of the log mercury concentrations in fish, poultry, and red meat-based dry dog foods (17 dog foods representing each for animal based protein source). Boxes represent the 25 and 75th percentiles, and whiskers represent the minimum and maximum. Solid lines within boxes represent the median values. Dashed lines indicate human intake (mg/Mcal) based on mean daily consumption. *indicated a significant difference from both red meat and poultry based diets (p < 0.01).