
FIGURE 2.
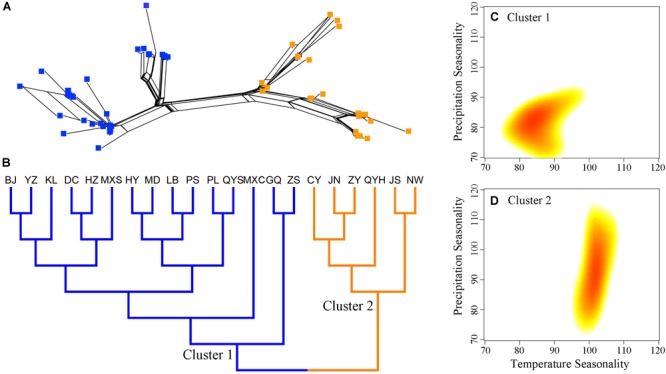
Genetic structure and climatic distributions among populations of Quercus liaotungensis. Genetic relationships of individuals (A) and populations (B) indicate consistent population structures for Q. liaotungensis. Climatic distributions of temperature and precipitation seasonality (C,D) using two-dimensional kernel density estimation show distinct ecological adaptation among populations from Cluster 1 and Cluster 2. Blue squares and branches represent individuals and populations of Cluster 1, while orange squares and branches indicate individuals and populations from Cluster 2. Red color in climatic distributions indicates climatic regions with the highest density of populations from each cluster.