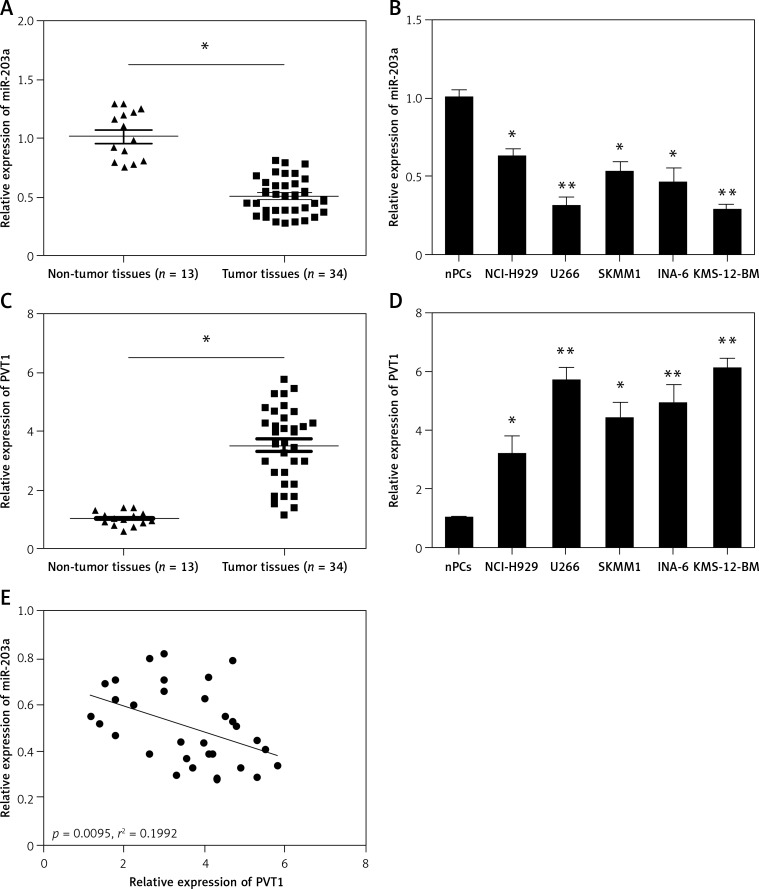
Figure 1.
Relative expression of PVT1 and miR-203a in MM. A – Relative expression of PVT1 was determined by qRT-PCR in MM samples and healthy controls. B – Relative expression of PVT1 was tested by qRT-PCR in MM cell lines and normal plasma cells (nPCs). C – Relative expression of miR-203a was determined by qRT-PCR in MM samples and healthy controls. D – Relative expression of miR-203a was assessed by qRT-PCR in MM cell lines and nPCs. E – The correlation between PVT1 and miR-203a expression level was measured in MM samples using Pearson correlation analysis
*P < 0.05, **p < 0.01.

