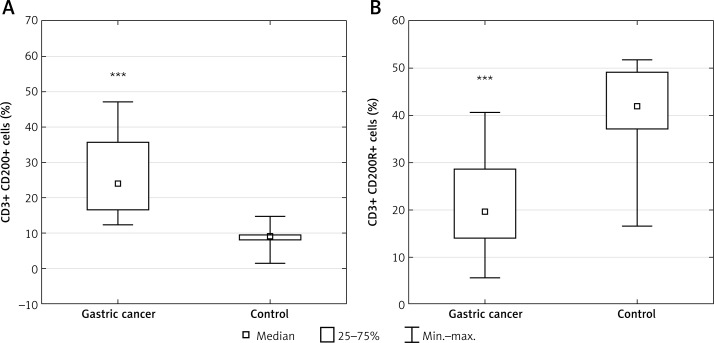
Figure 2.
Diagrams presenting: A – the difference between the percentage of CD3+/CD200+ lymphocytes in gastric cancer (GC) patients and healthy controls (***p < 0.00013 vs. control); B – the difference between the percentage of CD3+/CD200R+ lymphocytes in GC patients and healthy controls (***p < 0.0009 vs. control)

