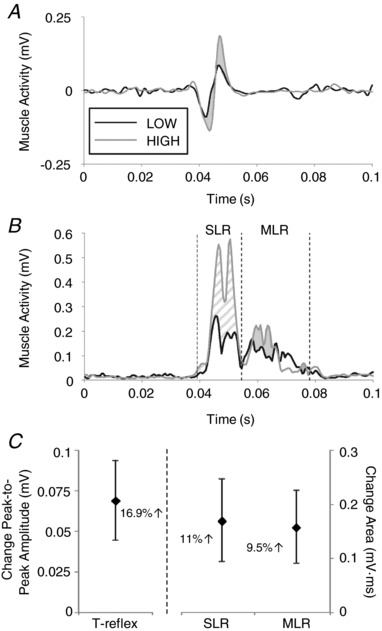
Figure 3. Height‐induced threat increased tendon‐tap and ramp stretch reflex amplitudes.

Waveform averages of unrectified t‐reflexes (A) and rectified SLR and MLR responses (B) from a single representative participant. LOW condition traces are drawn in black and HIGH in grey, with vertical dashed lines indicating the bounds of the region of interest for SLR and MLR traces and shading for effect to highlight where the HIGH response is greater than LOW (SLR patterned, MLR solid shading). Groupwide mean differences are shown in (C), with error bars indicating SE and the percentage change given for reference.
