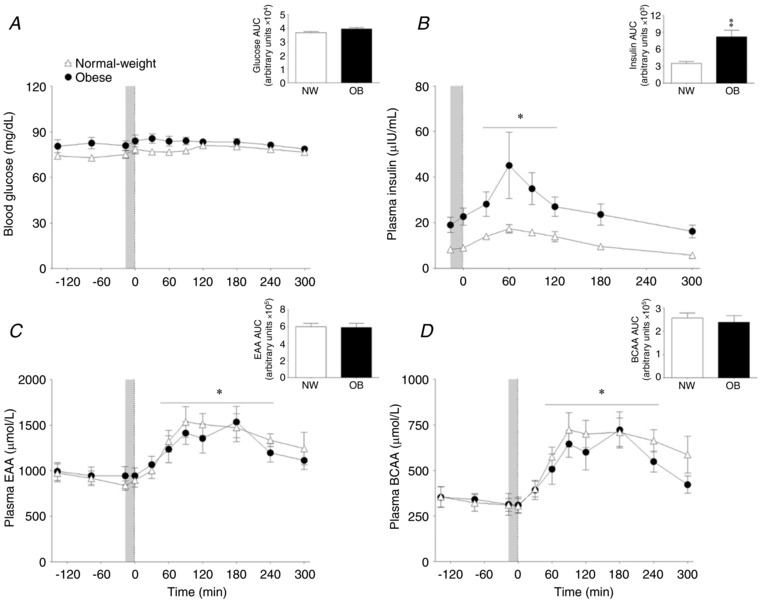
Figure 2. Blood variables.

Blood glucose (A) and plasma insulin (B) EAA (C) and BCAA (D) concentrations in the basal state and after pork ingestion (n = 9 per group). Inset are the respective area under the time curves. Grey bar indicates a bout of unilateral leg extension exercise. Dashed vertical line refers to pork ingestion. Data are the mean ± SEM. Insulin concentrations – Group effect: P = 0.002. * P < 0.05 vs. basal. ‡P < 0.05 vs. NW.
