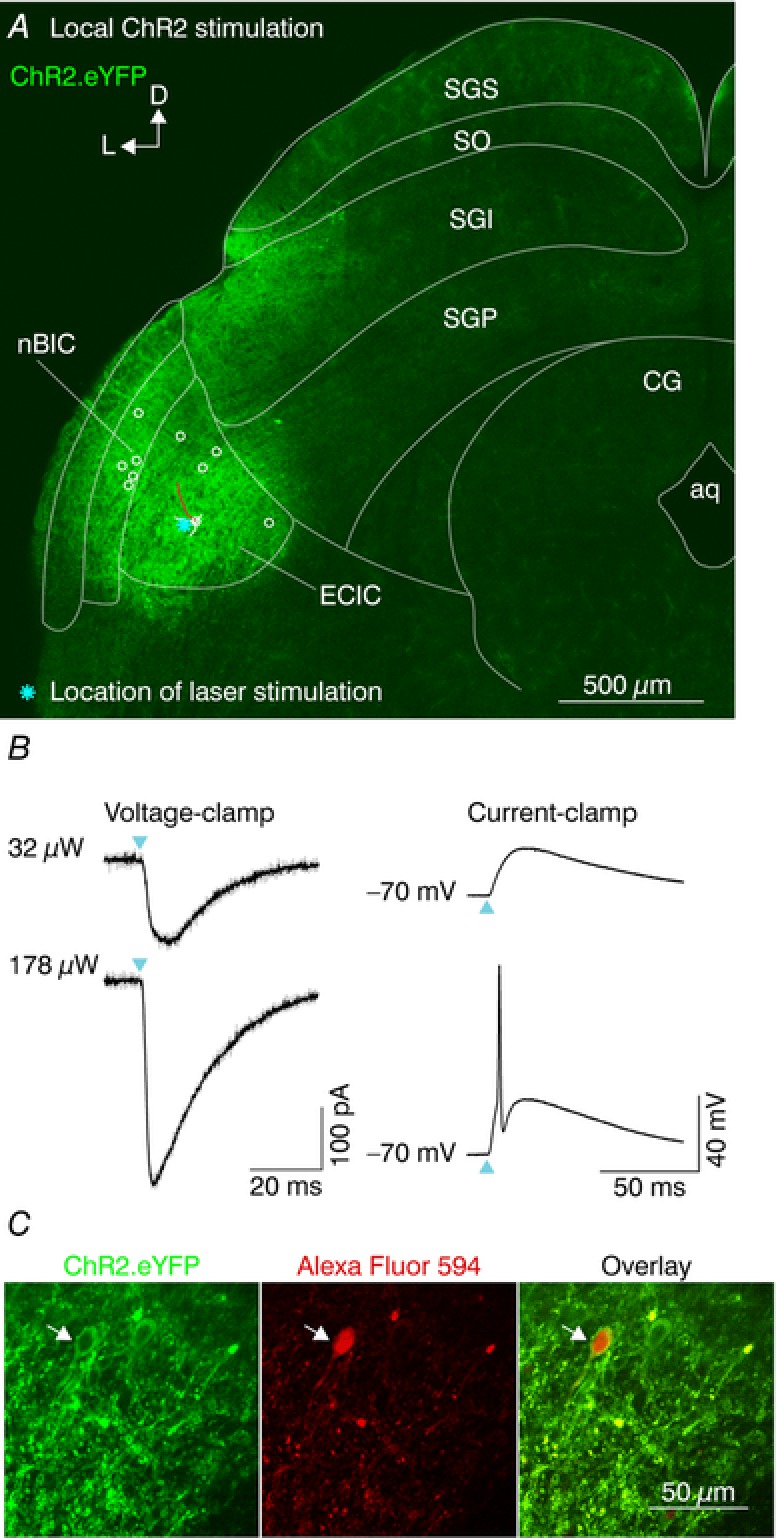
Figure 2. Optical activation of ChR2‐positive neurons in the nBIC/ECIC.

A, confocal image of a brain slice showing eYFP fluorescence in the nBIC/ECIC. An example ECIC neuron was partially traced (white lines, dendrites and soma; red line, axon). Locations of all nBIC (n = 5) and ECIC (n = 5) neurons are shown with open circles. Cyan asterisk shows the laser position for an example ECIC recording shown in B. B, example recording of local ChR2 stimulation. Voltage‐clamp (left, V holding = −70 mV) and current‐clamp (right) recordings of an ECIC neuron at low (top) and high (bottom) laser intensities. Cyan triangles indicate the laser onset. Grey and black traces represent individual trials and the average, respectively. C, two‐photon images of a recorded neuron located in the ECIC (white arrow) showing ChR2.eYFP fluorescence (left), Alexa Fluor 594 fluorescence (middle) filled via the patch pipette, and their overlay (right).
