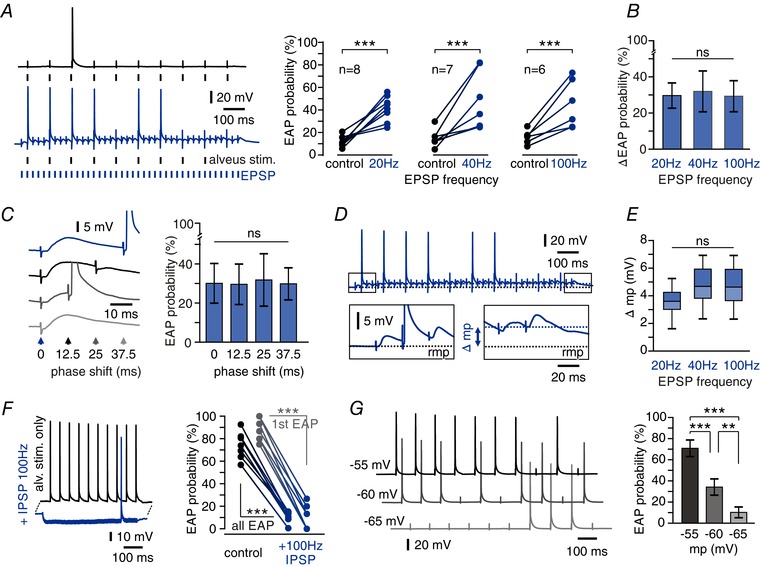
Figure 4. Repetitive synaptic input modulates axonal excitability via DC potential shifts.

A, facilitation of EAP firing by repetitive synaptic stimulation. Left: ectopic stimulations (10 Hz) trigger more EAPs when paired with repetitive EPSP induction (40 Hz; blue trace) than alone (black trace). Right: EAP probability of ectopic stimulations alone and combined with repetitive EPSP induction at frequencies indicated. All frequencies exhibit robust facilitation of EAP firing (*** P < 0.001, paired t test). B, there is no significant difference in facilitation between synaptic stimulation at 20, 40 or 100 Hz (P = 0.9572, one‐way ANOVA test). C, a phase shift between synaptic and ectopic stimulation has no effect on EAP facilitation. Left: representative traces show synaptic stimulations (40 Hz) paired with ectopic stimulations (10 Hz) after varying delays as indicated by arrowheads. Right: EAP facilitation by EPSPs elicited with different phase relations to ectopic stimulation showed no significant differences (n = 6 cells, mean ± SD, P = 0.9980, one‐way ANOVA, ns = not significant). D, repetitive EPSPs caused long‐lasting membrane potential (mp) shifts. Boxes show expanded time scales of first and last stimulations. Repetitive stimulation produced a prolonged somatic depolarization reaching ∼5 mV between first and last stimulation (rmp, resting membrane potential). E, DC shift of membrane potential after orthodromic stimulation at different frequencies. No significant difference was found between stimulations at 20, 40 and 100 Hz (n = 7 cells, P = 0.0656, one‐way ANOVA). Box plots indicate median, 25th and 75th percentiles and 2.5th and 97.5th percentiles (whiskers). F, repetitive inhibitory input (100 Hz) hyperpolarizes CA1 pyramidal cells and strongly suppresses EAP generation. Left: example traces show 10 Hz ectopic stimulation yielding 10 EAPs under control conditions (black trace) and 1 EAP during repetitive induction of IPSPs (blue trace). Right: summary plot of EAP probability for control vs. 100 Hz IPSPs (black symbols: whole train, grey: first ectopic stimulation only; n = 6 cells, *** P < 0.001, paired t test). G, somatic membrane potentials directly modulate EAP probability. Left: traces show EAP induction at membrane potentials set to −55 mV (top), −60 mV (middle) and −65 mV (bottom) via somatic current injection. Right: mean EAP firing probability for the different membrane potentials (n = 9 cells, mean ± SD, *** P < 0.001, ** P < 0.01, one‐way ANOVA followed by Bonferroni's post hoc test).
