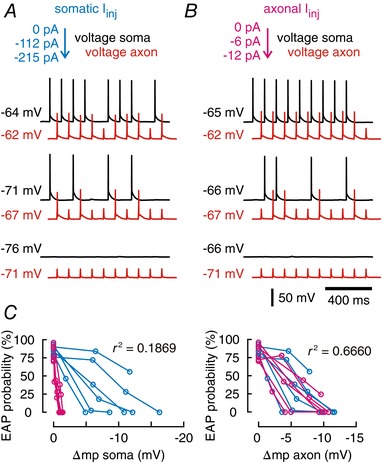
Figure 5. Modulation of EAP initiation by somatic membrane potentials depends on local changes in axonal voltage.

A, example traces for near‐threshold ectopic stimulation through axonal patch pipette (10 Hz, 3 ms) at resting membrane potential (top traces, black: somatic recording, red: axonal recording) vs. more hyperpolarized potentials (trace pairs below). Somatic hyperpolarization was controlled by current injections through the somatic pipette, while the axon was recorded current free. Soma–axon distance was 146 μm for this recording. B, the axon is hyperpolarized to the same axonal potentials as recorded in A by axonal current injection (black: somatic recording, red: axonal recording). The somatic potential was recorded current free (compare Fig. 2 C). C, mean EAP firing probability vs. change of somatic membrane potential (Δmp; left panel) and vs. axonal membrane potential (right panel). Data from experiments shown in A (magenta, somatic current injection) and B (cyan, axonal current injection; n = 6 cells).
