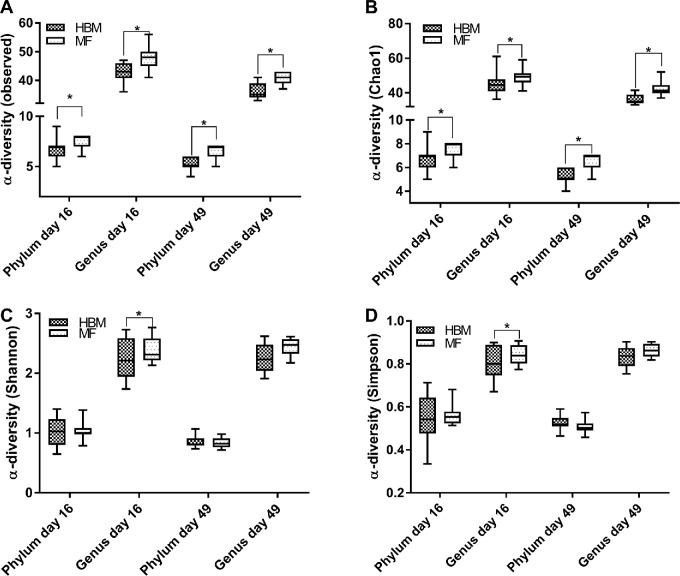
FIGURE 5.
α-Diversity boxplots for piglets at the phylum and genus levels for observed (A), Chao1 (B), Shannon (C), and Simpson (D) indexes at 16 d in HBM (n = 14) and MF (n = 15) diet groups and at 49 d in the HBM (n = 11) and MF (n = 12) diet groups. Upper and lower hinges (boxes) are minimum and maximum values within the IQR and the solid lines are median values. Data were analyzed by Mann-Whitney U test. *Different between groups, P < 0.05. HBM, human breast milk; MF, milk formula.

