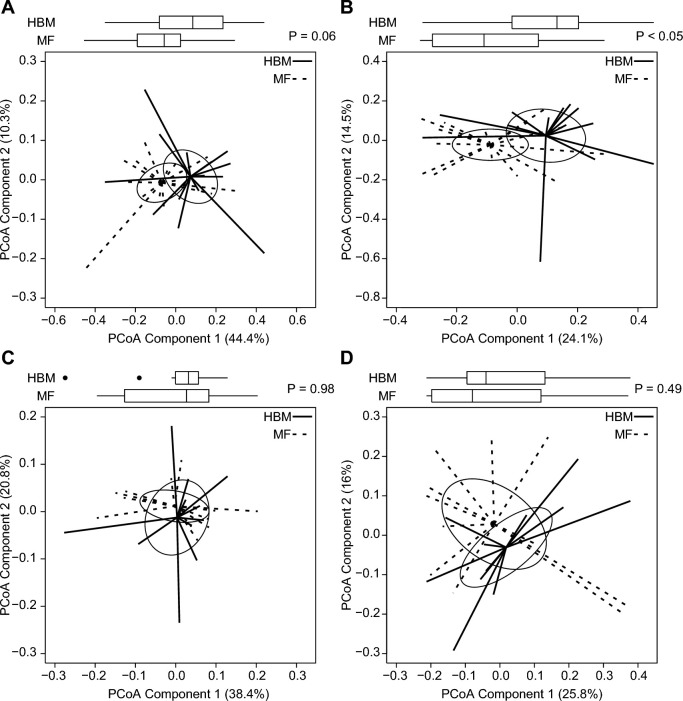
FIGURE 6.
Box and spider plots represent Bray-Curtis estimates of β-diversity for piglets for phylum (A) and genus (B) in HBM (n = 14) and MF (n = 15) diet groups at 16 d and for phylum (C) and genus (D) in HBM (n = 11) and MF (n = 12) diet groups at 49 d. Box plot outliers are shown as black dots outside the whiskers. Solid and dashed lines extend from diet group medoids to the PCoA score for an individual piglet. Ellipses represent the SE of the point scores along the 2 components. P values represent group differences among PCoA scores along component 1 (Mann-Whitney U test). HBM, human breast milk; MF, milk formula; PCoA, principal coordinates analysis.

