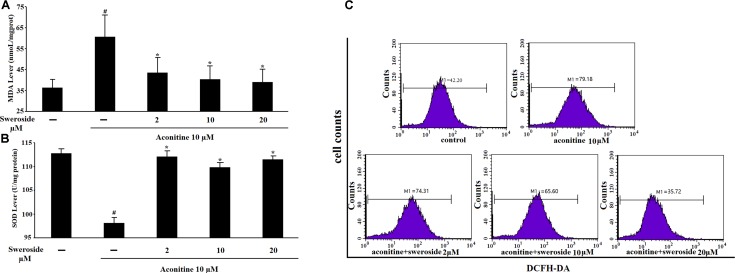
FIGURE 3.
The influence of sweroside on aconitine-induced oxidative stress and intercellular ROS production in H9c2 cells. (A) Effects of sweroside on MDA content under aconitine treatment in H9c2 cells; (B) Effects of sweroside pretreatment on SOD product in H9c2; (C) Flow cytometry analysis of aconitine-induced ROS. n = 3 (n, the number of experiments). #P < 0.05 vs. control, ∗P < 0.05 vs. aconitine group.

