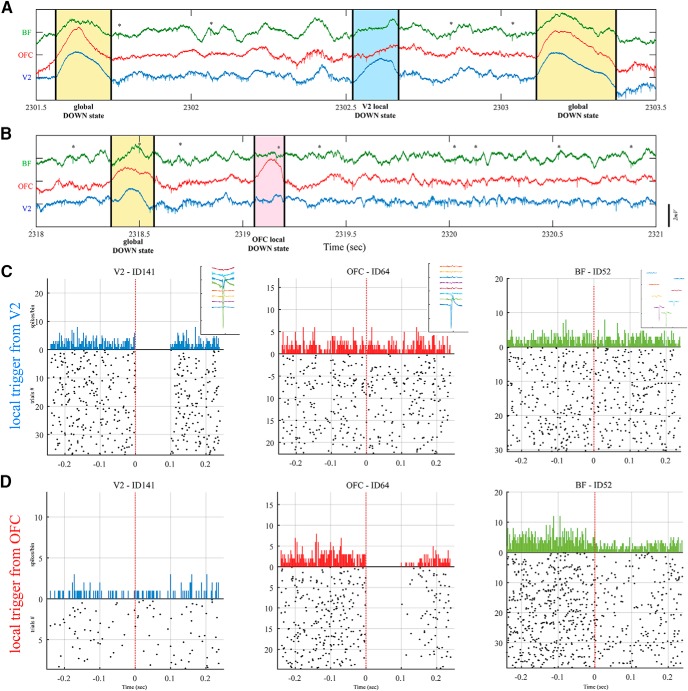
Figure 2.
A, B, Multisite recording of field and unit activity in the awake rat from BF (green), OFC (red), and V2 (blue) displaying high-amplitude slow fluctuations: UP and DOWN states. Global DOWN states were localized from all structures (yellow areas) and separated from the local DOWN state of V2 (A, blue area) and from OFC (B, red area). Stars above spikes denote cholinergic firing from BF. C, Peristimulus time histogram (PSTH) of neurons from V2 (first column), OFC (second column), and BF (third column) triggered (red dashed lines) by the onset of the V2 DOWN state. Subplots at upper right corner of each of PSTH shows the spike waveform from silicon electrode arrays. D, PSTH of the same neurons from V1, OFC, and BF triggered by the onset of the DOWN state from OFC locally.

