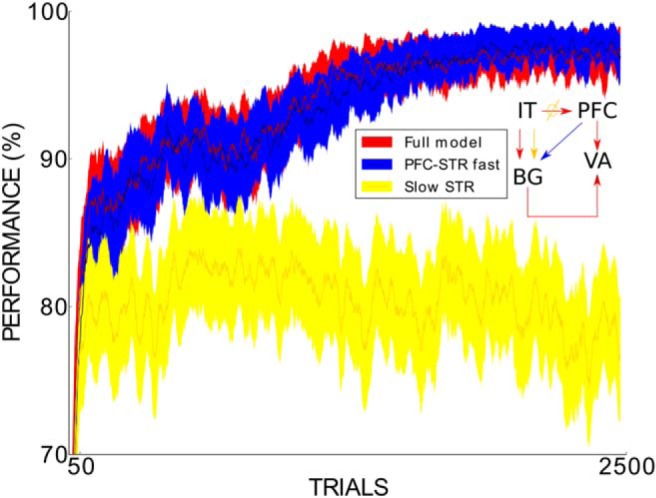
Figure 13.

Across-trial performance of the full model (dark red line), the full model with an extra connection from the PFC to the STR (dark blue line), and a model with the slow learning in the STR instead of the PFC (gold line) across the 2500 trials of the task with real-world face stimuli. For each of the 2500 trials, performance was averaged across 100 experimental runs. SEMs are also shown (filling color around the lines). A 25-trial window was used to smooth the plot. The 64 model parameters were set to their base values in all considered simulations. The small model sketch summarizes the main difference between the three models.
