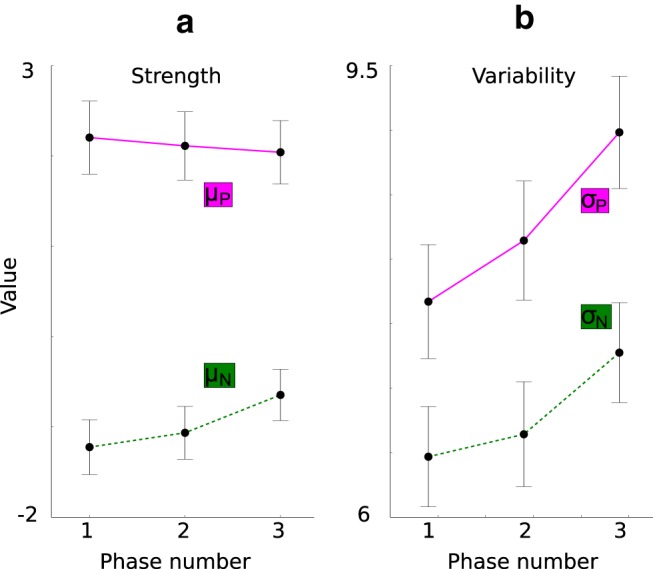
Figure 14.

Analysis of the individual components of the striatum d′ sensitivity index computed from the monkeys' recordings obtained in the cue period. For each phase, the last trial time bin is plotted. a, Mean response to the preferred category (dots in magenta line, μP) and to the nonpreferred category (dots in green line, μN) per phase. The preferred category is the category for which each STR cell responds on average most strongly in each single trial time window. Because neural spiking activity tended to rise with time of recording, we had to correct the neural firing rate to the pretrial baseline and thus the negative average firing rate for the nonpreferred category. b, Mean SD of the response to the preferred category (dots in magenta line, σP) and to the nonpreferred category (dots in green line, σN) per phase.
