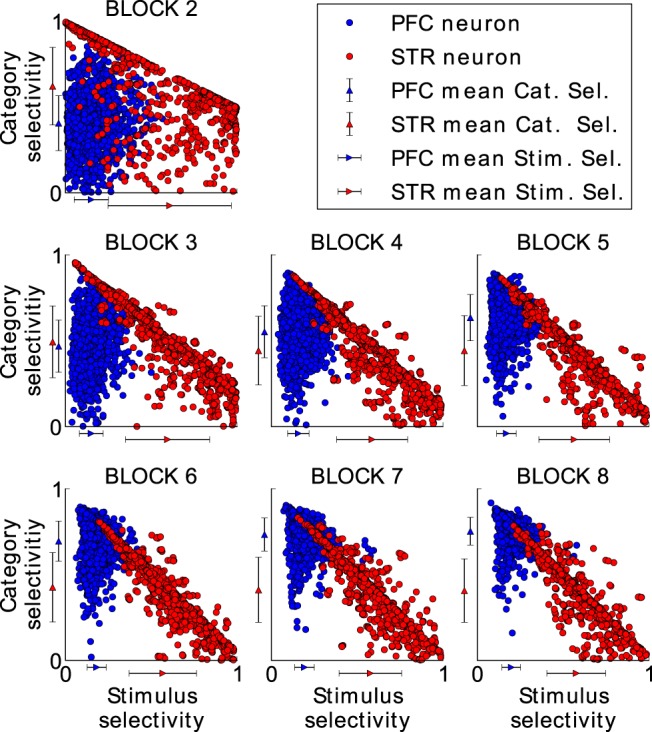
Figure 7.

Category and stimulus selectivity for each model cell in the striatum (red dots) and in the PFC (blue dots) in all successful experiments. Both selectivities were measured at the end of each block as outlined in the Materials and Methods section. The first block was omitted because there was only one stimulus per category, so stimulus selectivity could not be computed. A maximum category selectivity of 1 indicates that the corresponding cell responds maximally to all stimuli of one category and becomes inactive for the stimuli from the other category. Maximum stimulus selectivity, in contrast, indicates that the corresponding cell responds to a single stimulus with maximum activity, but that it remains inactive for the rest of the stimuli from the same category. Although the category selectivity in the PFC clearly increases with each block,the category selectivity in the striatum does not and cells stay stimulus selective. The mean category and the mean stimulus selectivity of the PFC and STR cells is shown at each axis by a blue and red triangle, respectively. Error bars indicate the SD.
