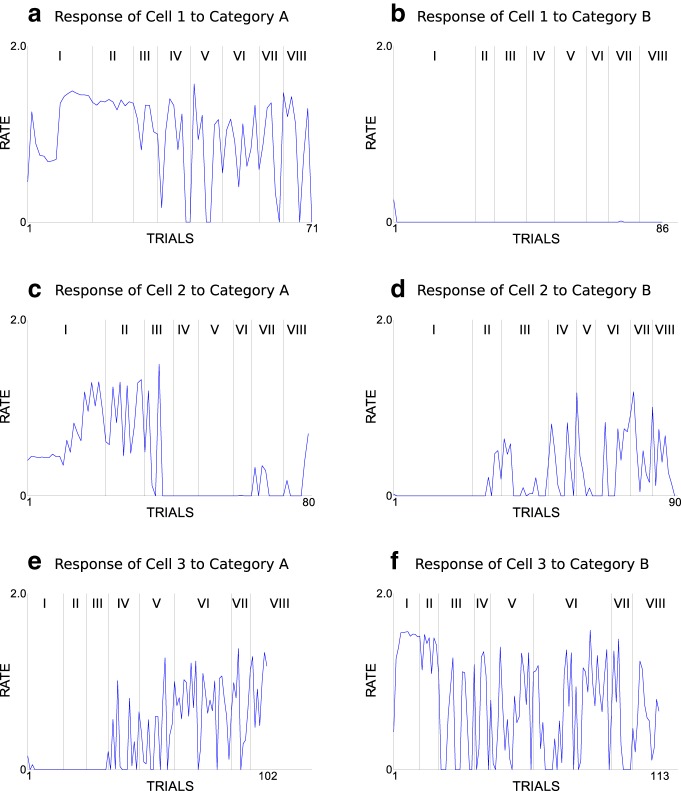
Figure 8.
Firing rates of three typical striatal cells plotted across all trials of one experimental run subdivided for presentation of stimuli from category A (left subplots) and category B (right subplots). The seven vertical lines indicate borders between the eight blocks (I, II, III, IV, V, VII, and VIII). a, firing rate of cell 1 across the trials that present a stimuli of category A in one experimental run. b, firing rate of cell 1 across the trials that present a stimuli of category B in the same experimental run. c and d show the same as a and b but for cell 2. e and f show the same as a and b but for cell 3. The 64 model parameters were set to their base values.

