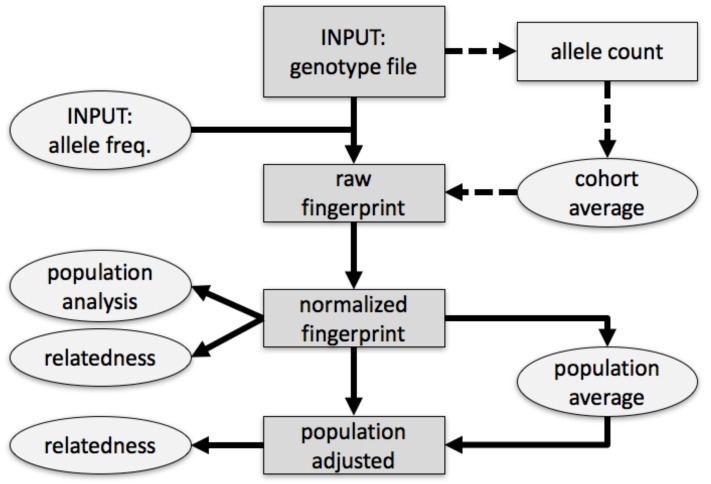
Figure 1.
Overview of method. Single nucleotide polymorphisms (SNPs) in the input genotype file were encoded into a table (raw) by observed alleles and rsid numerical value, considering allele frequencies. This could optionally be approximated by subtracting allele counts estimated from a simple model of an observed cohort (dashed arrows). The raw fingerprint was then normalized and could be adjusted to represent deviation from the center of the closest population. Rectangles and ellipses pertain to individual genotypes or to multiple genotypes, respectively; darker gray denotes the flow of information for one genotype from the input file to the normalized and adjusted fingerprints.

