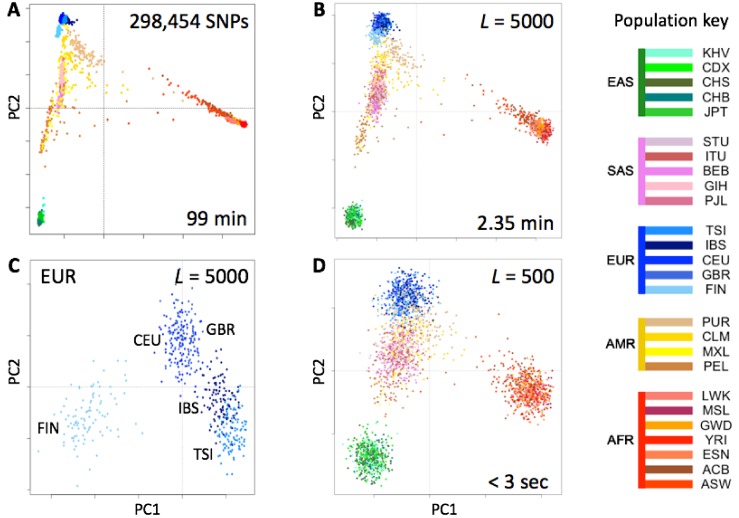
Figure 3.
Estimates of population structure in the 1000 Genomes Project data set at different resolutions. Individuals are color coded according to their population as per the key to the right. EAS, SAS, EUR, AMR and AFR: East Asian, South Asian, European, Admixed American, and African, respectively. (A) Principal components analysis (PCA) of the 2504 individuals using ~300,000 SNPs. (B) PCA on genotype fingerprints (N = 2504) with L = 5000. (C) PCA on genotype fingerprints of European populations (N = 503) with L = 5000. (D) PCA on genotype fingerprints (N = 2504) with L = 500.

