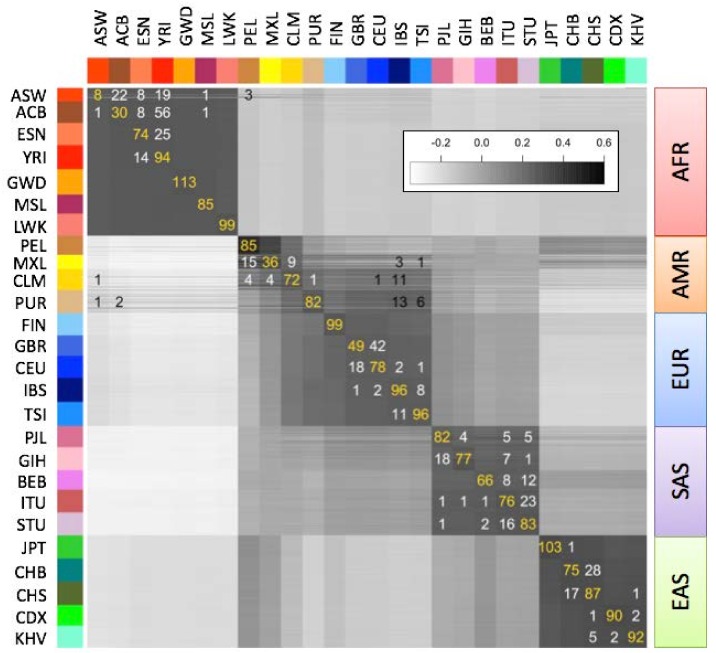
Figure 4.
Correlations between the genotype fingerprints of the 2504 individuals (rows) and the average fingerprints of the 26 populations (columns) in the 1000 Genomes Project. Population codes and colors as in Figure 3. Numbers in gold, white, and black denote population assignments: to the same annotated population, to the same continent but different population, or to a different continent, respectively. Inset: correlation color scale.

