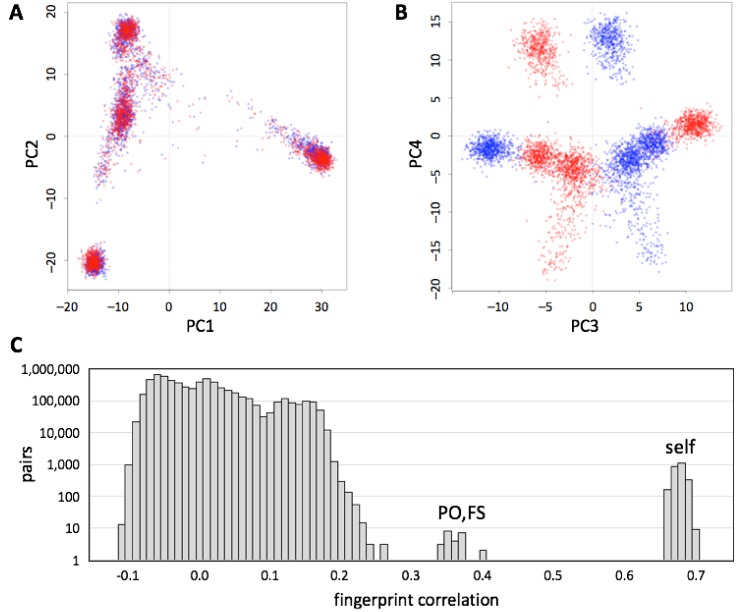
Figure 5.
Comparison of genotype fingerprints relative to different SNP lists. We deduced normalized genotype fingerprints (L = 5000) for the 1000 Genomes Project cohort using the 23andMe V2 (red) and V3 (blue) SNP lists. (A) First two principal components, showing population structure. (B) Third and fourth principal components, showing separation between the two SNP lists. (C) Distribution of cross-correlations between the two sets of genotype fingerprints (all possible pairs of V2 vs. V3). Comparisons between the two genotype fingerprints for the same individual (self) and comparisons between parent/offspring and full-sibling pairs (PO, FS) formed distinct, high-correlation subsets.

