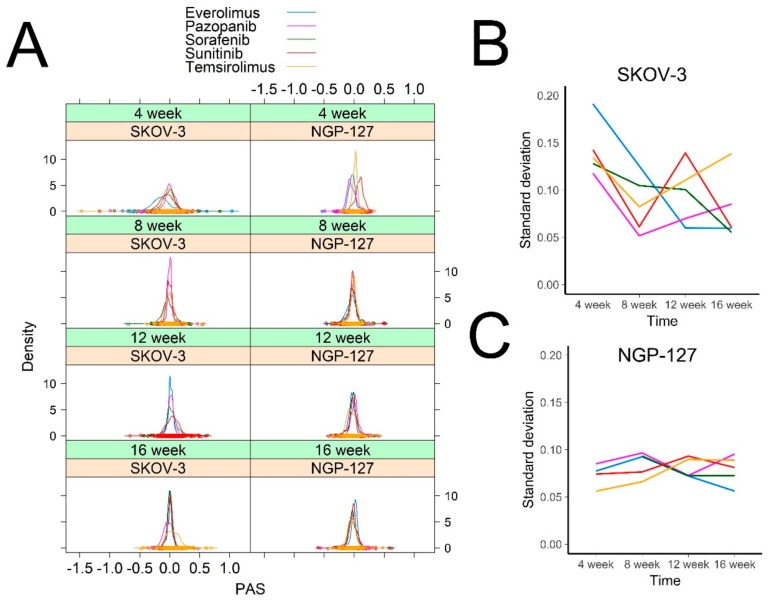
Figure 2.
Distribution of PAS values over time. (A) A density plot was built for each cell line for each drug and for each timepoint. Each curve shows density of Pathway Activation Strength for 378 signaling pathways. Density plots were built using Lattice R package (B,C). Standard deviation of PAS values for SKOV-3 (B) and NGP-127 (C) cells treated with target drugs for 1 to 4 months.

