Figure 2.
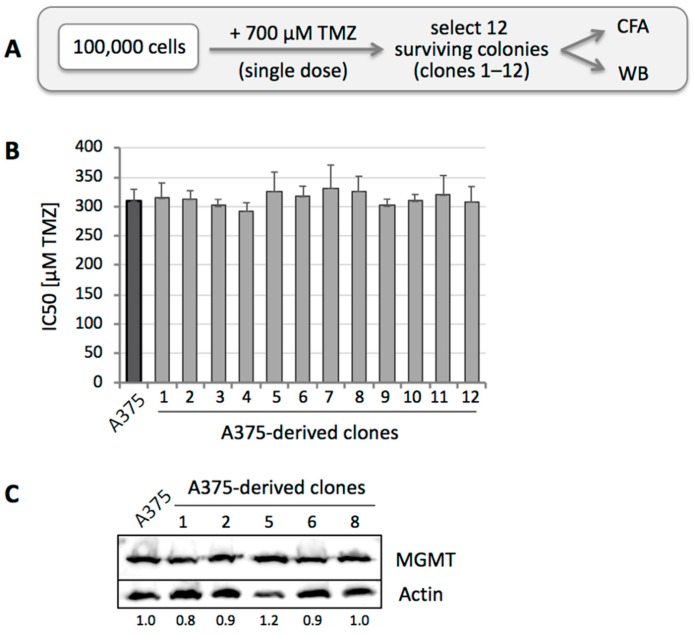
Selection of A375 clones after high-dose TMZ treatment. (A) Treatment schedule was as follows: 105 A375 cells (MGMT positive) were seeded into a 10-cm dish and treated with a single dose of 700 µM TMZ for 48 h. Two weeks later, 12 surviving clones (numbered 1 through 12) were isolated for further analysis by WB and CFA. (B) All twelve clones were subjected to CFA with increasing concentrations of TMZ. Shown is the average IC50 of each clone, in comparison to parental A375 cells (left bar in black) (n = 2–5, ±SE). (C) Five of these cell clones were lysed, and MGMT protein levels were analyzed by WB with actin as the loading control. Left lane shows lysate from parental A375 cells. Numbers under the blot indicate quantification of MGMT bands, with reference to the actin signal, and relative to A375 cells (left lane, set at 1.0).

