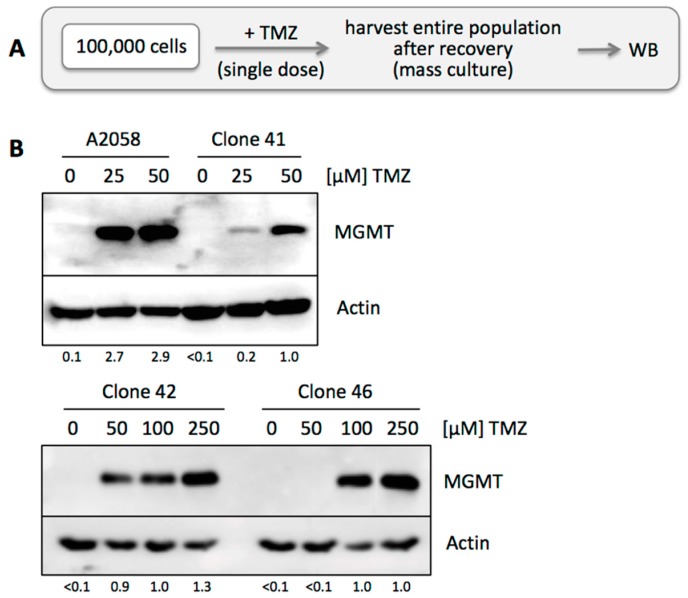
Figure 6.
Emergence of MGMT protein in MGMT-negative clone. (A) Treatment schedule was as follows: 105 cells were seeded into the wells of a 6-well dish and treated with a single dose of TMZ at increasing concentrations from 0 to 50 µM for 48 h. Surviving cells were kept in culture until the population had regrown sufficiently to harvest enough cells for WB analysis. (B) Cell lysates were prepared from mass cultures of surviving A2058 cells and from clone 41, followed by WB analysis of MGMT protein levels. Actin was used as a loading control. Numbers under the blots indicate quantification of MGMT bands, with reference to the actin signal, and relative to the intensity in the right lane (set at 1.0); <0.1 indicates below detection limit.

