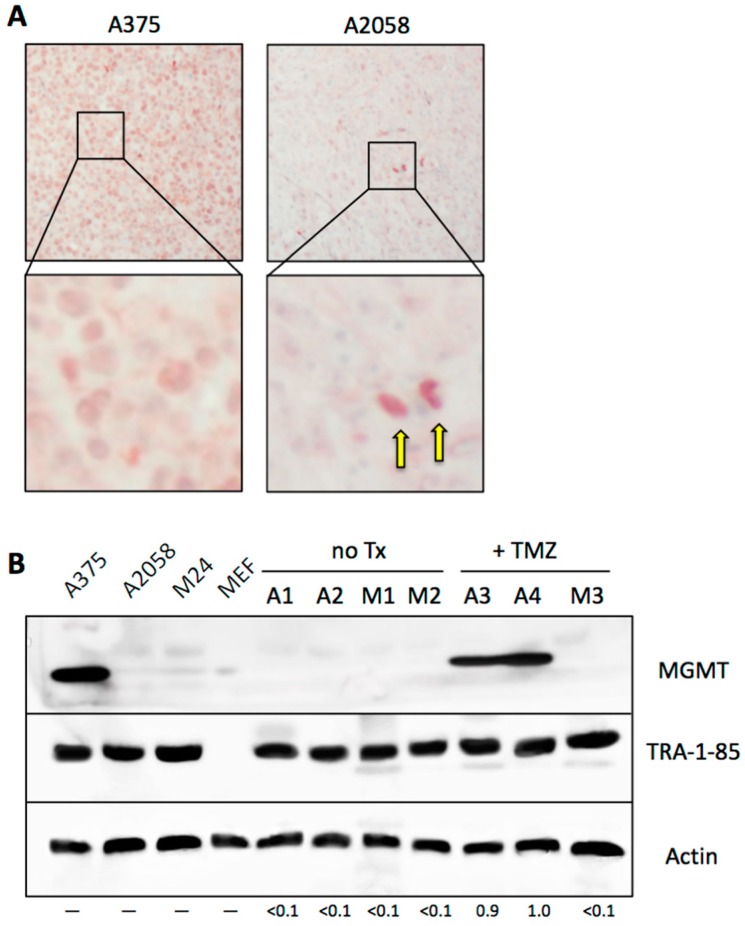
Figure 10.
MGMT expression in tumor tissue. (A) Nude mice were injected subcutaneously with 4 × 10⁶ MGMT-positive A375 cells or with MGMT-negative A2058 cells. Once pea-sized tumors had developed, tumor tissue was harvested and subjected to immunostaining for human MGMT. While A375 tissue showed positive staining in most cells, A2058 tissue revealed positivity only in a small minority of cells (2 examples are indicated by arrows in the enlarged section). (B) Western blot was performed with crude lysates from cells cultured in vitro (A375, A2058, M24, and MEF) and from xenograft tumor tissues (A1–A4: tumors derived from implanted A2058 cells; M1–M3: tumors derived from implanted M24 cells), using a human-specific MGMT antibody. A1, A2, M1 and M2 are tumors from mice that only received vehicle treatment (control); A3, A4 and M3 are tumors from mice that received TMZ therapy (M4 animal was lost). To confirm the presence of human tumor cells in tissues harvested from mice—especially in those lanes where the MGMT signal was negative—we used an antibody against TRA-1-85/CD147, an epitope that is present only on human cells, but not mouse cells. Please note that specificity of this antibody was confirmed by lack of reactivity with the lane containing lysate from mouse embryo fibroblasts (MEF). Actin was used as the loading control. Numbers under the blot indicate quantification of MGMT bands, with reference to the actin signal, and relative to A4 sample (set at 1.0); <0.1 indicates below detection limit; only lanes with tumor tissue samples were measured.

