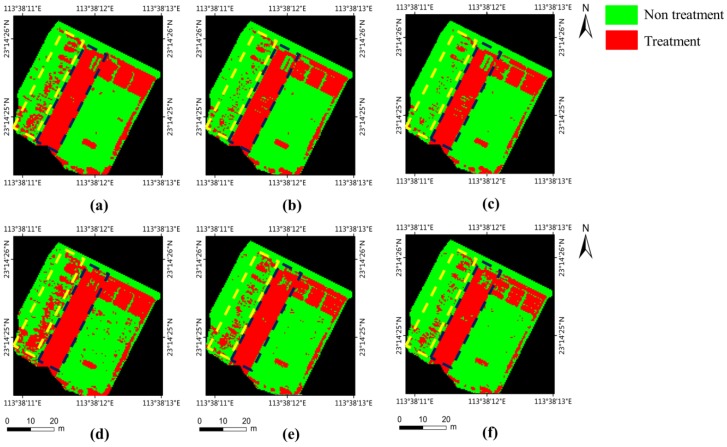
Figure 7.
Prescription map generated with different weed thresholds. (a–c) Prescription map generated from the GT label using the weed thresholds of 0.0, 0.1 and 0.2. (d–f) Prescription map generated from the output weed cover map using the thresholds of 0.0, 0.1 and 0.2. From reference system datum WGS84.

