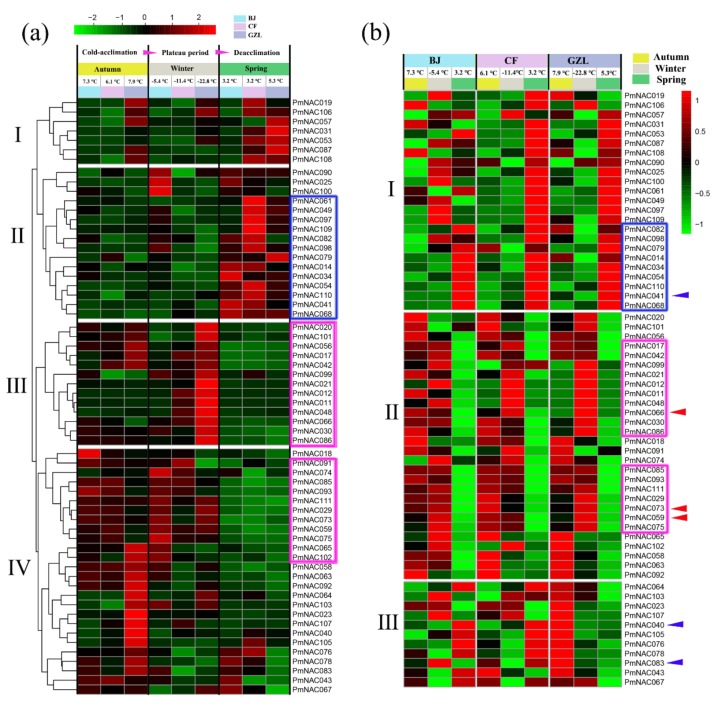
Figure 6.
(a) Expression profiles of PmNACs in stems of ‘Songchun’ in different regions (Beijing, Chifeng and Gongzhuling) and seasons (autumn, winter and spring). (b) Comparison of differential expression profiles of stems in Beijing, Chifeng and Gongzhuling during different seasons. Pink rectangle presents genes showing relatively high expression levels at low-temperature (below −5 °C). Aqua-blue rectangle indicates genes having consistent expression patterns and highly expressed in spring (above 3 °C). The expression levels were normalized by row using Z-Scores algorithms. Color scale at the top of heat map refers to relative expression level, and the color gradient from green to red shows an increasing expression level. Alpha numeric presents hierarchical clustering of gene expression. Red arrows present membrane-bound PmNACs, and the blue arrows present Pmu-miRNA164-targeted-genes.

