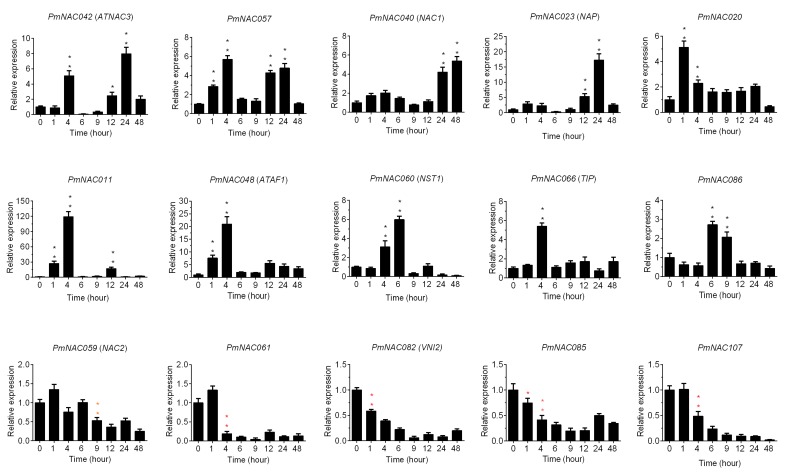
Figure 7.
Expression analyses of 15 candidate PmNACs in P. mume crossing lines (CP1) exposed to 4 °C for different time (0/1/4/6/912/24/48 h), where 0 h indicates control. The relative quantification method (2−ΔΔCT) was used to evaluate quantitative variation. Error bars represent standard error for three replicates. Significance levels of up-regulated expression: * < 0.05; ** < 0.01. Significance levels of down-regulated expression: * < 0.05; ** < 0.01.

