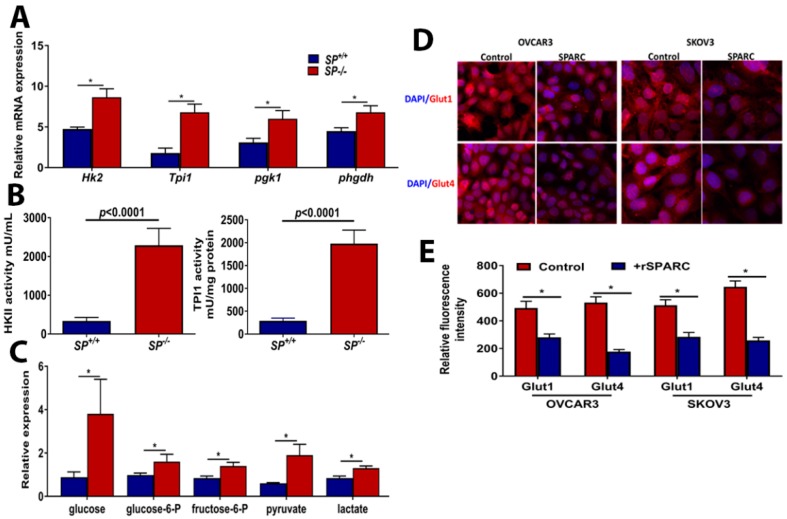
Figure 2.
Effect of host-SPARC on glycolysis: (A) Bars depicting mean ± SEM of the changes in the transcripts (n = 3/genotype), (B) HK2 and TPI1 activity in ID8 tumors grown in SP−/− and SP+/+ mice. Bars represent the mean ± SEM of the measured (n = 6/genotype; unpaired Student’s t-test). (C) The levels of glycolysis metabolites (n = 6/genotype) between ID8 tumors grown in SP−/− and SP+/+ mice. p < 0.05, Student’s t-test. (D) Confocal immunofluorescence showing the expression of glucose transporters Glut1 and Glut4 in OVCAR3 and SKOV3 treated with 10 µg/mL SPARC for 24 h (magnification 100×). (E) Bars represent mean ± SEM of the mean fluorescence intensity of expression of Glut1 and Glut4. * p < 0.05, Mann-Whitney test.

