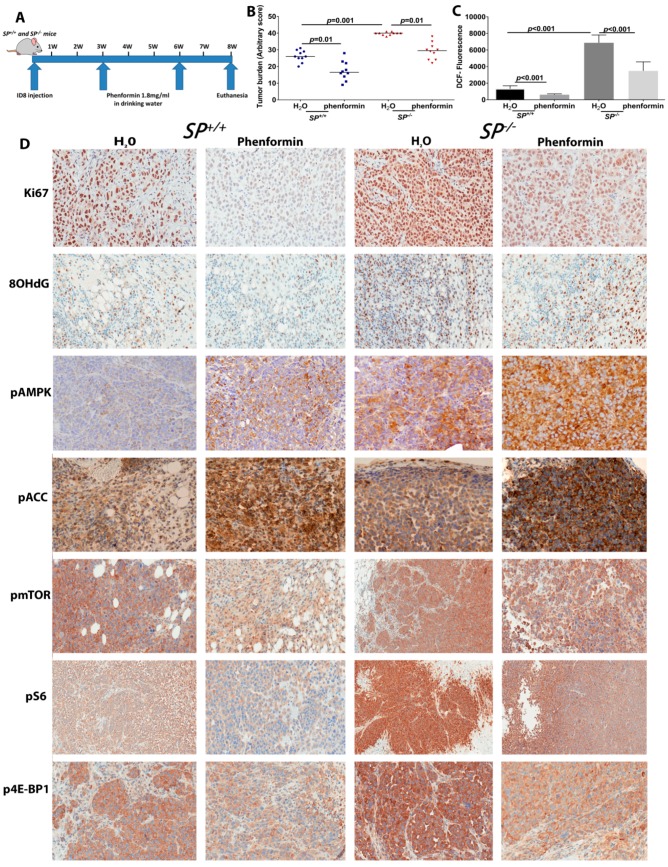
Figure 9.
Effect of phenformin on syngeneic ID8 tumors in SP−/− and SP+/+ mice. (A) Schema of the mouse therapeutic trial with phenformin. (B) Scatter plots showing the effect of phenformin on syngeneic tumor burden in SP−/− and SP+/+ mice. p < 0.05. (C) Bars depict mean ± SEM of the levels of H2O2 in syngeneic tumors determined by DCF fluorescence. p < 0.05, Student’s t-test. (D) Immunostaining of syngeneic tumors with the indicated antibodies (200×).

