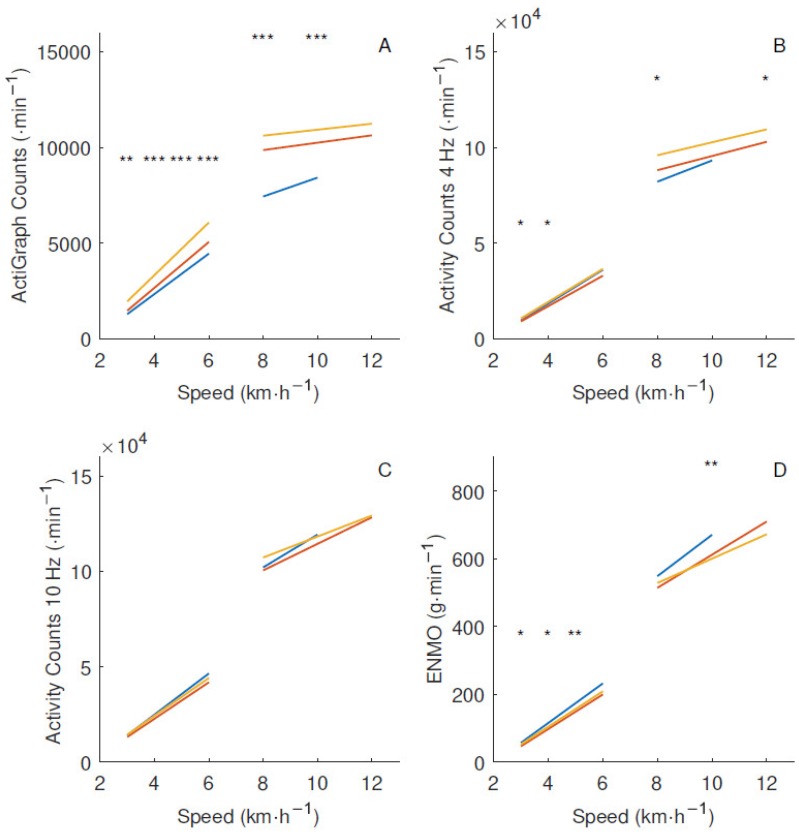
Figure 5.
Number of counts at different treadmill speeds with separate linear regressions representing walking and running with 10 subjects in each age group. Children: blue, adolescents: red, adults: yellow. (A) ActiGraph filter; (B) 4 Hz filter; (C) 10 Hz filter; (D) Euclidian Norm Minus One (ENMO). Age-group difference from a one-way ANOVA at *: 0.01 ≤ p < 0.05, **: 0.001 ≤ p < 0.01, and ***: p < 0.001.

