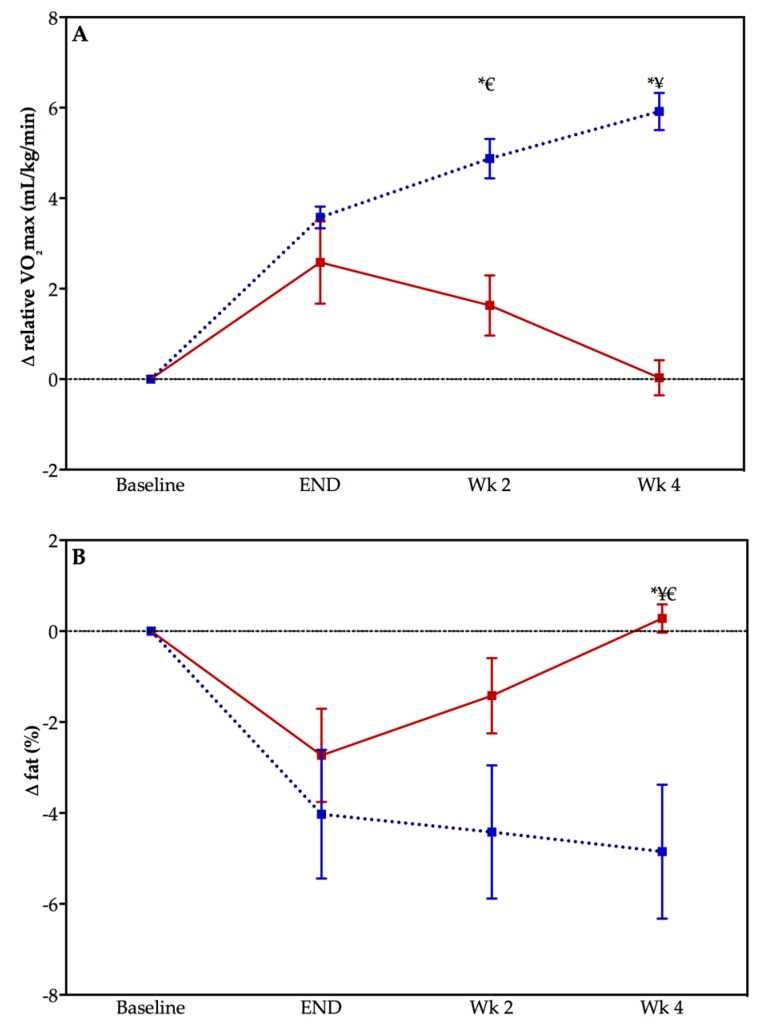
Figure 3.
Change in cardiorespiratory fitness (panel A) and body fat percentage (panel B) in previously sedentary adults who either detrained (DETRAIN; red bars, solid line), or trained (TRAIN; blue bars, dotted line). Please note that baseline is not included in statistical analysis but is included to indicate the change in the variable with the exercise training program. Data displayed as mean ± S.E.M, * p < 0.05 comparison between groups, ¥ p < 0.05 compared with “end” time point DETRAIN group, € p < 0.05 compared with “end” time point TRAIN group.

