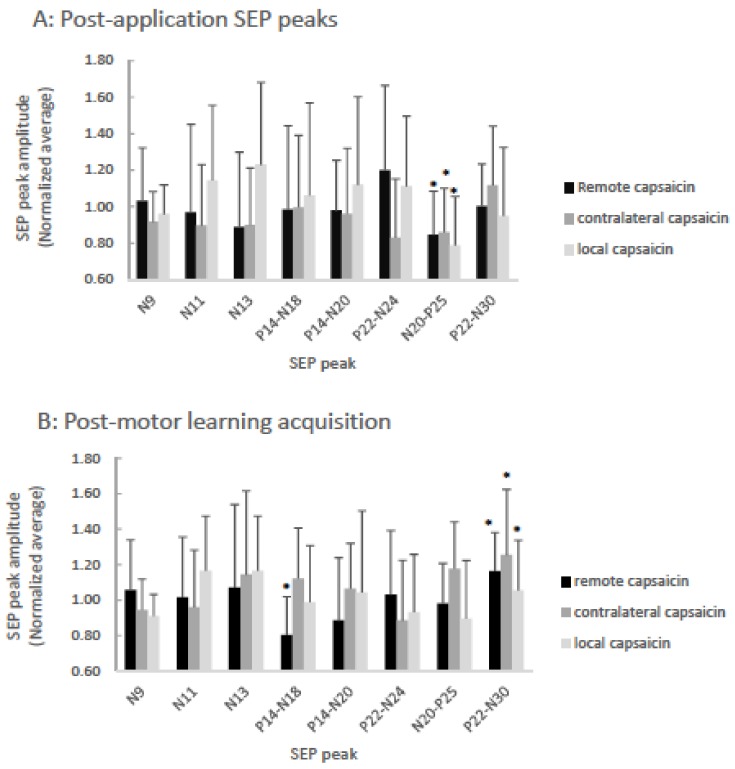
Figure 3.
Bar-graph of averaged normalized (to pre-motor learning values) SEP ratios showing capsaicin versus remote versus contralateral groups post-application (A), and post-motor learning acquisition (B). A: The P25 (p < 0.001) SEP peaks significantly decreased following the application of capsaicin cream for all groups as indicated by asterisks. B: Following motor learning acquisition, significantly different changes from baseline are indicated by asterisks for the remote group N18 SEP peak (p = 0.02) and for all three groups the N30 (p = 0.002) SEP peaks were significantly increased. Error bars represent the standard deviation.

