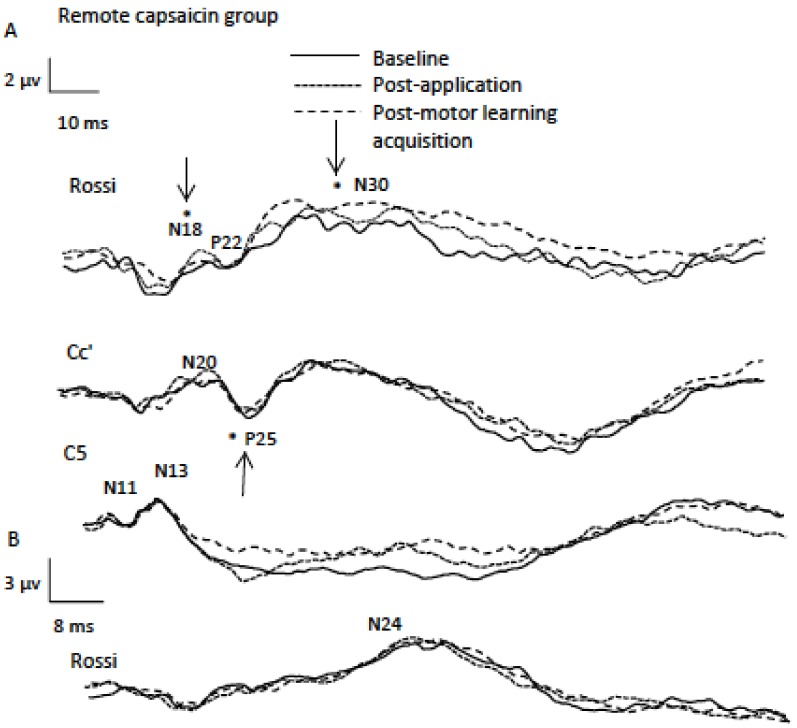
Figure 4.
Data from a representational remote participant (average of 1000 traces) indicating SEP peaks including A (2.47 Hz) and B (4.98 Hz) sessions. Note the significant differences for the P25 SEP peak following capsaicin application and for the N18 and N30 SEP peaks following motor learning acquisition as indicated by asterisks.

