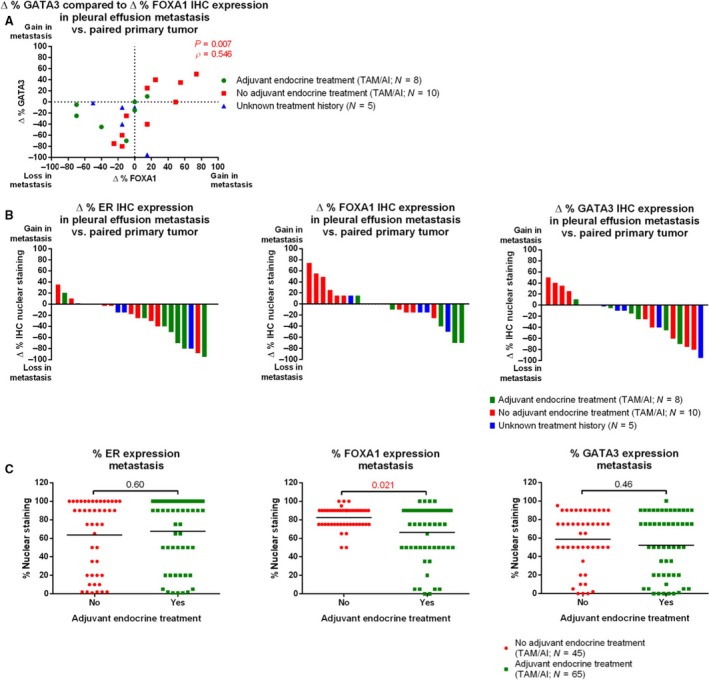
Figure 2.

Decreased FOXA1 expression levels in metastases after prior tamoxifen exposure. (A) Scatterplot visualizing percentage change of FOXA1/GATA3 levels in paired pleural metastases vs. primary breast tumors from the same patients. Correlation was calculated with Spearman's rho. Samples from patients receiving adjuvant tamoxifen (green), no adjuvant endocrine treatment (red), or unknown adjuvant treatment (blue) are visualized separately. (B) Waterfall plot showing changed expression of ERα (left), FOXA1 (middle), and GATA3 (right) in paired analyses on pleural metastases relative to primary breast cancers, compared with Mann–Whitney U‐test. Patients receiving adjuvant tamoxifen (green), no adjuvant endocrine treatment (red), or unknown adjuvant treatment (blue) are indicated. (C) Expression levels of ERα (left), FOXA1 (middle), and GATA3 (right) in pleural metastases, from patients who either did (green) or did not (red) receive adjuvant endocrine treatment, compared with Mann–Whitney U‐test. Mean is indicated.
