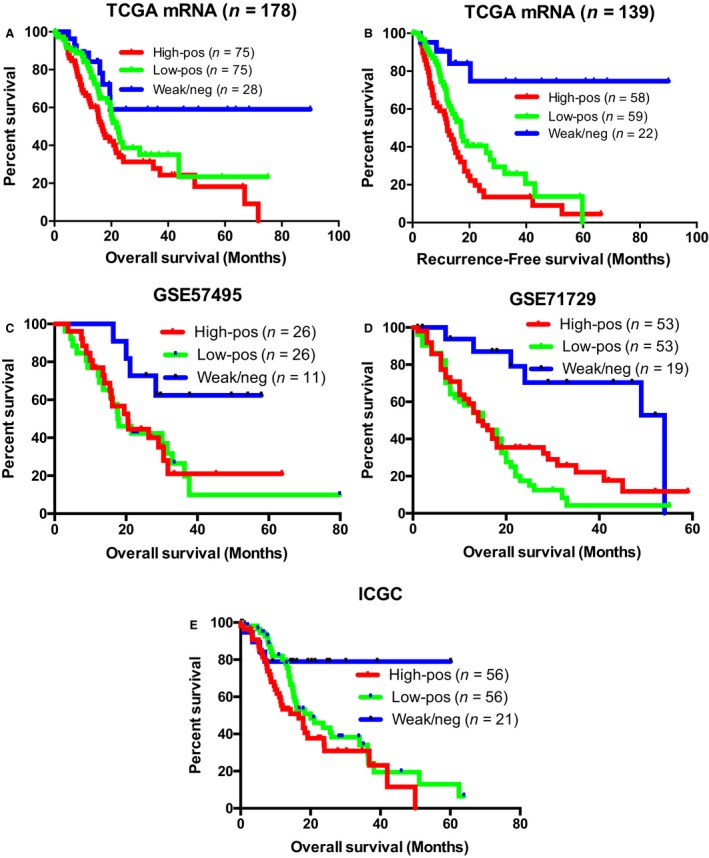
Figure 2.

S100A10 mRNA expression is predictive of overall and RFS in four PDAC patient cohorts. Kaplan–Meier (KM) plots of OS (A,C–E) and RFS (n = 139; B) of PDAC patients based on their S100A10 mRNA expression. Patients in (A,B) are from the TCGA provisional cohort. Patients in (C,D,E) are derived from Chen et al. (2015, http://www.ncbi.nlm.nih.gov/protein/GSE57495), Moffitt et al. (2015, http://www.ncbi.nlm.nih.gov/protein/GSE71729), and ICGC. The ternary cutoff was applied to classify the high‐positive, low‐positive, and weak/negative subgroups. P‐values were adjusted to the Bonferroni‐corrected threshold. Adjusted P‐value is P‐value/K = 0.017 where K = 3 and represents the number of comparisons made (Table S3).
