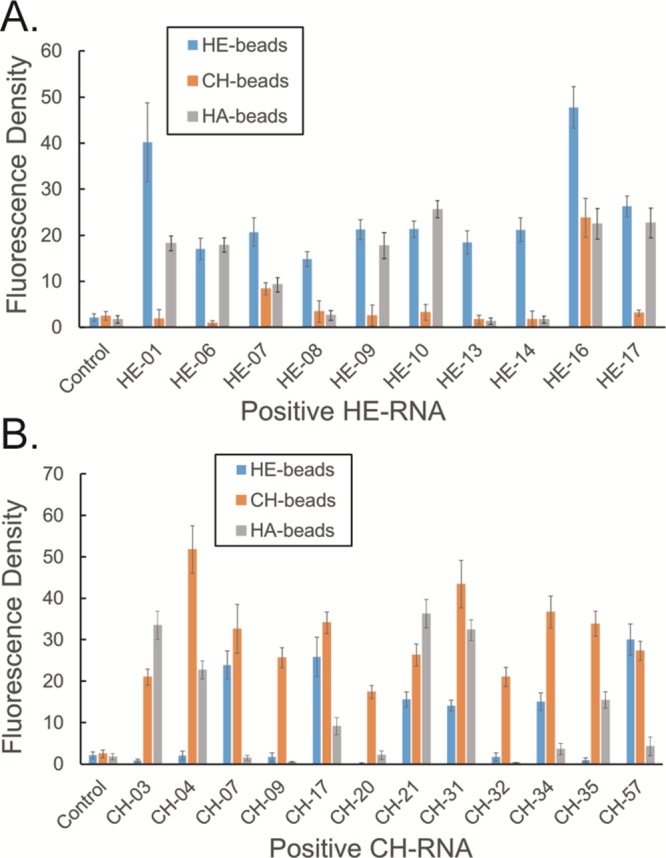
Figure 4.

Cross-screening of RNA–GAG interaction. Confocal microscopy imaging of (A) HE and (B) CH aptamers screened against HE, CH, and HA beads. The “Confocal field” indicates the fluorescent channel image of the confocal microscopy, whereas the “bright field” indicates the bead optical channel image.
