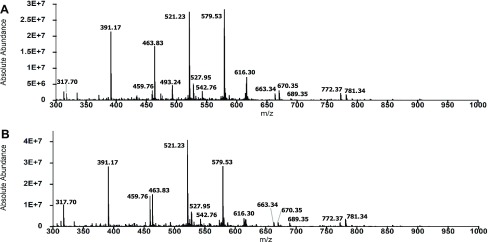
Figure 5.
Primary fragments of Aβ42 were not degraded significantly by IDE at pH 7.4 and 4 °C. (A) Total mass spectrum of the 2 h digest shows the dominant presence of peaks corresponding to Aβ42 fragments resulting from initial cleavages. (B) Total mass spectrum of the 6 h digest is essentially similar to the spectrum of the 2 h digest. Dominant peaks in (A) and (B) are labeled by their m/z ratios (also detailed in Tables S1 and S2).

