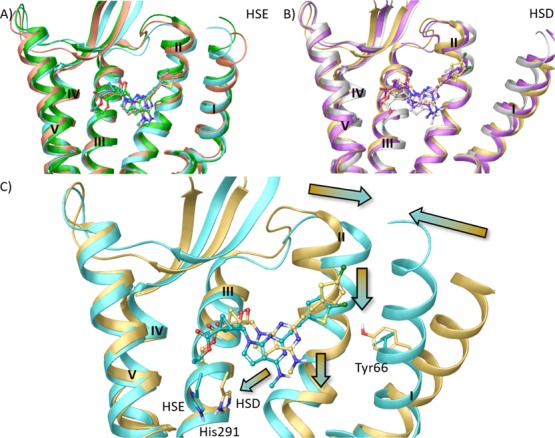
Figure 5.

Superimposition of ligand–protein complexes characterized by lowest IE values during the MD simulation (replicas represented with different colors) of (A) HSE and (B) HSD hKOR models in complex with N6-methyl 5′-ethylester 7-deaza (N)-methanocarba derivative 28 (ball and sticks representation). (C) Superimposition of ligand–protein complexes characterized by lowest IE values among three replicas (see Table S2) for the HSE (cyan ribbon, and ligand in cyan ball and sticks) and the HSD (yellow ribbons, ligand in yellow ball and sticks) hKOR models in complex with N6-methyl 5′-ethylester 7-deaza (N)-methanocarba derivative 28. Side chains of residues undergoing considerable conformational changes during the MD simulation are highlighted (sticks representation with carbon atoms matching the color of the model). Arrows indicate the shift of ligand position and TMs between the two models. TM6, EL3, and TM7 were omitted to aid visualization. The PDB coordinates of both complexes are available as separate Supporting Information files. The PDB ID of the X-ray structure used as starting points for molecular modeling was 4DJH.
