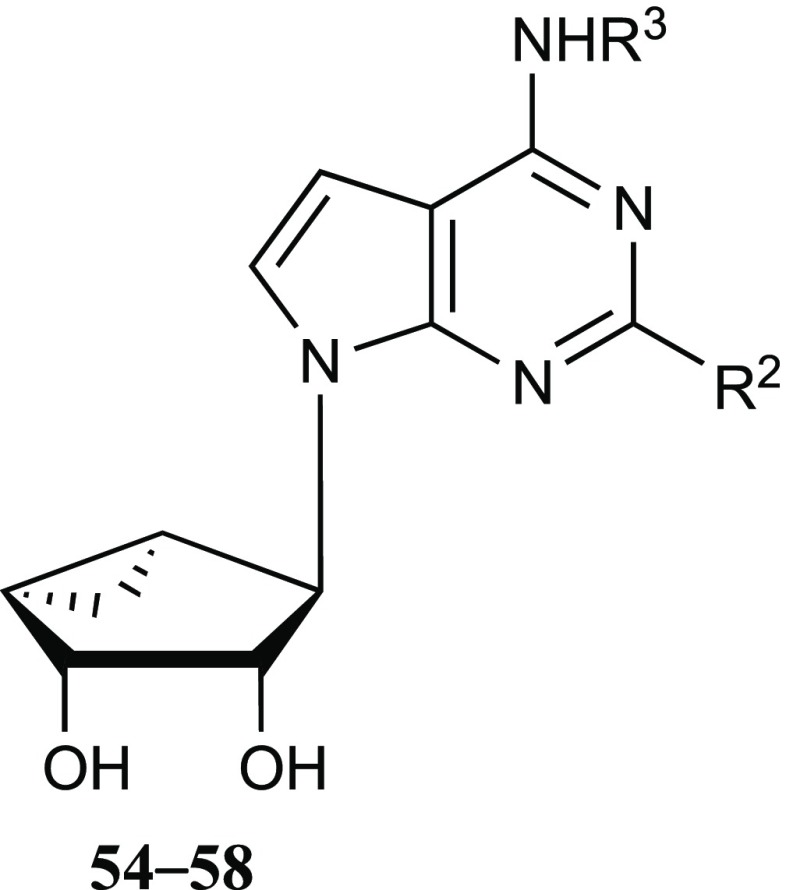
Table 5. Binding Activity of 4′-Truncated (N)-Methanocarba Derivatives at hORs, hA3AR and TSPO and Transporters; 4′-Truncated (N)-Methanocarba 7-Deaza-adenosine Derivativesa.
| compound | R2= | R3= | DOR,bKi, nM | KOR,bKi, nM | MOR,bKi, nM | TSPO,bKi, nM | A3AR binding Ki, nM (species),c or % of control at 10 μM |
|---|---|---|---|---|---|---|---|
| 54a | phenyl-ethynyl | CH3 | d | 1120 ± 220 | 2670 ± 280 | e | 85.6 ± 12.0 (h), 11 ± 1% (m) |
| 55a | phenyl-ethynyl | (CH2)2-Ph | 3660 ± 1330 | 1370 ± 180 | 4020 ± 890 | 2120 ± 230 | 217 ± 65 (h), 29 ± 2% (m) |
| 56 | phenyl-ethynyl | CH(cPr)2 | 2550 ± 660 | d | 1440 ± 750 | 4210 ± 1840 | 178 ± 32 (h) |
| 57 | 5-Br-thienyl-ethynyl | CH(cPr)2 | >10 000 | 3020 ± 90 | >10 000 | >10 000 | 2440 ± 430 (h) |
| 58 | I | CH(cPr)2 | e | e | e | e | 5310 ± 1310 (h) |
DAT and NET binding inhibition is <50% at 10 μM, unless noted. 54: DAT, −58%; 55: NET, Ki = 5.56 μM.
Binding assays performed as specified in Table 1, unless noted. Values are expressed as the mean ± SEM (n = 2–4). Values are expressed as the mean ± SEM of N = 2–4 assays performed in duplicate.
A3AR binding data from Tosh et al.2,3,6,34,35,37 Representative binding Ki values at hA1AR (nM): 55, 1300 ± 290; 56, 650 ± 71; determined as reported.37 Values are expressed as the mean ± SEM of N = 3 assays performed in duplicate.
30–50% inhibition of radioligand binding at 10 μM.
<30% inhibition of radioligand binding at 10 μM.

