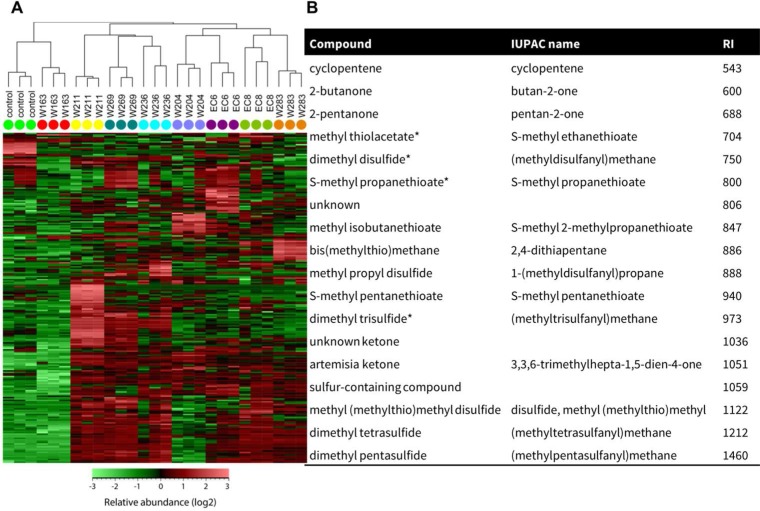
FIG 4.
Volatile organic compounds (VOCs) from Microbacterium strains. (A) Hierarchical cluster and heat map analyses of VOC profiles of Microbacterium. Columns represent three replicate VOC measurements of each of the 8 isolates and the medium alone (control). Rows represent the different VOCs (green, low abundance; red, high abundance). (B) List of VOCs from Microbacterium strain EC8. VOCs displayed were detected only for EC8 or were significantly different (Student's t test, P < 0.05, n = 3) and detected at peak intensities at least twice as high as those in the control (medium only). Compounds were putatively annotated by comparing their mass spectra and calculated linear retention indices (RI) with those of NIST and in-house mass spectral libraries and standard (*).

