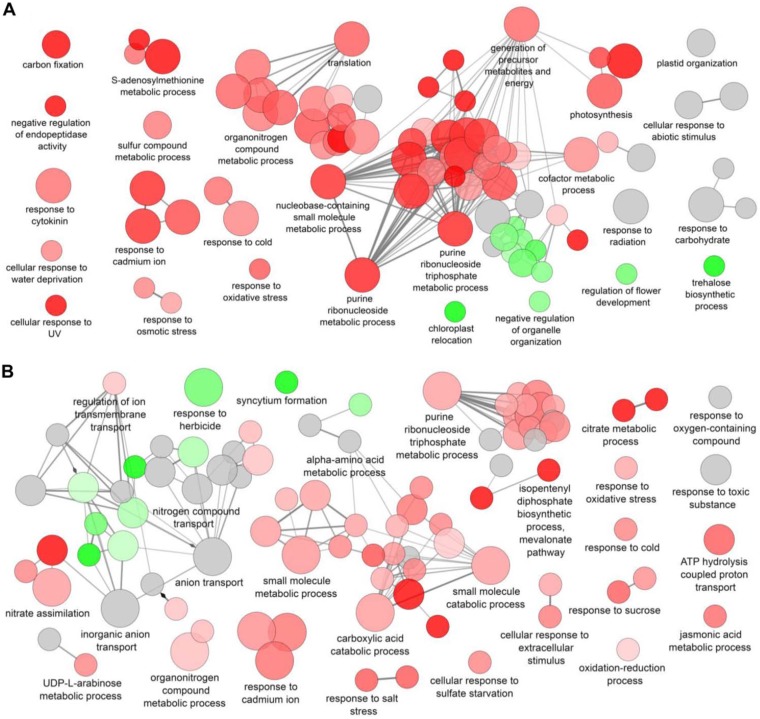
FIG 6.
Global visualization of GO terms assigned for differentially expressed genes (DEGs) of Arabidopsis exposed to volatiles from Microbacterium strain EC8. Functional groups of upregulated DEGs of shoots (A) and roots (B) are shown in red, whereas downregulated DEGs are shown in green. Functional groups with upregulated and downregulated DEGs are shown in gray. Single cluster analysis was performed using Cytoscape software with the ClueGO plugin. The fusion option was used to reduce redundancy of GO terms. Networks with terms functionally grouped with GO pathways are indicated as nodes (two-sided hypergeometric test corrected with the Benjamini-Hochberg procedure; P < 0.05) linked by their kappa score levels (≥0.4), with only the label of the most significant term per group shown. The node size represents the term enrichment significance; smaller nodes indicate larger P values, while larger nodes indicate smaller P values.

